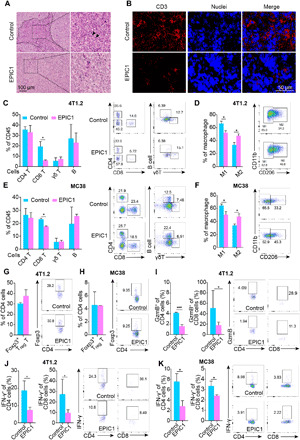
Fig. 3. EPIC1 decreases cytotoxic T lymphocyte infiltration and activation.

(A) Control and EPIC1-overexpressed 4T1.2 tumors were paraffin embedded and applied with hematoxylin and eosin staining. Black arrows indicate the immune cells. (B) Frozen sections from the empty vector (control) and EPIC1 overexpressed (EPIC1) 4T1.2 tumors were subjected to immunostaining analysis of CD3 (red) along with 4′,6-diamidino-2-phenylindole for nuclei (blue). (C to H) Quantification of indicated TILs from control and EPIC1-overexpressed 4T1.2 or MC38 tumors in BALB/c mice or C57BL/6 mice, respectively (n = 5 for control, n = 5 for EPIC1 overexpression). TILs were analyzed by flow cytometry on the 15th day after transplantation. The right panel of each figure indicates the representative flow cytometry profiles. (I) The production of granzyme B by CD4+ and CD8+ TILs in 4T1.2 tumors was analyzed by flow cytometry, respectively. The right panel shows the representative flow cytometry profiles. (J and K) The production of interferon-γ (IFN-γ) by CD4+ and CD8+ TILs in 4T1.2 and MC38 tumors was analyzed by flow cytometry, respectively. The right panel shows the representative flow cytometry profiles. Data are means ± SD. *P < 0.05 **P < 0.01; ***P < 0.001.
