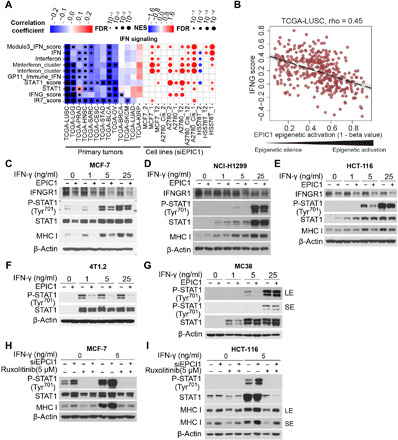
Fig. 5. EPIC1 inhibits IFNGR1 expression and type II interferon signaling.

(A) Heatmap (left) shows the association between EPIC1 expression and interferon signatures in TCGA patients. Color in the heatmap indicates the effect size. Dots indicate the logarithmic false discovery rate. Heatmap (right) shows the pathway changed after EPIC1 knockdown in different cell lines. The color of the dots in the heatmap indicates the enrichment score. The size of the dots indicates the false discovery rate. (B) Correlation between EPIC1 epigenetic activation and IFNG response score in immune response signature. (C to E) Immunoblot of IFNGR1, p-STAT, and MHC-I in human cancer cell lines MCF-7 (C), NCI-H1299 (D), and HCT116 (E) cells stably expressing empty vector (Control) or EPIC1 further treated with the indicated concentration of IFN-γ for 24 hours. (F and G) Immunoblot of p-STAT in murine breast cancer cells 4T1.2 and colorectal cancer cells MC38 stably expressing empty vector (control) or EPIC1 further treated with the indicated concentration of IFN-γ for 24 hours. LS, long exposure; SE, short exposure. (H and I) The measurement of p-STAT1 and MHC-I protein expression by immunoblot in MCF-7 (H) and NCI-H1299 (I) cells transduced with EPIC1 siRNA and further treated by JAK1/2 inhibitor ruxolitinib (5 μm) with/without IFN-γ (5 ng/ml). LS, long exposure; SE, short exposure.
