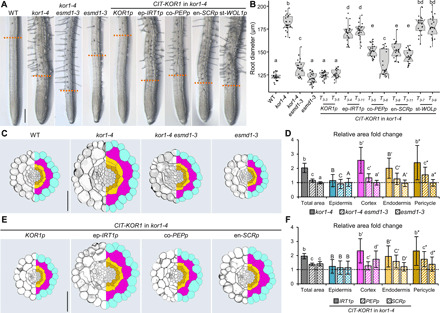
Fig. 4. Cortex cell enlargement in kor1 correlates with constitutive JA production.

(A) Representative primary root images of WT, kor1-4, kor1-4 esmd1-3, esmd1-3, and kor1-4 complemented with CIT-KOR1 under the control of its native KOR1p promoter, or epidermis (ep-IRT1p)–, cortex (co-PEPp)–, endodermis (en-SCRp)–, or stele (st-WOL1p)–specific promoters. Orange dashed lines define the initiation of the differentiation zone, as indicated by the appearance of root hairs in 7-do seedlings. (B) Box plot summary of primary root diameter at the onset of differentiation in 7-do seedlings of indicated genotypes. Medians are represented inside the boxes by solid lines, and circles depict individual measurements (n = 22 to 23). (C to F) Anatomy and cell size comparisons from transverse sections across the early differentiation zone of the primary root in (C and D) WT, kor1-4, kor1-4 esmd1-3, and esmd1-3, and in (E and F) kor1-4 complemented with cell type–specific promoters. (C and E) Representative split images from cross sections (left) and respective cell segmentations (right). Segmented cell types are color-coded as: epidermis, turquoise; cortex, magenta; endodermis, yellow; pericycle, mustard; stele, gray. (D and F) Fold change in total and cell-specific areas from segmented transversal root sections in indicated genotypes. Bars represent mean fold changes of individual cellular areas from 10 to 11 roots (±SD), normalized to values of the (D) WT or (F) KOR1p:CIT-KOR1 indicated by dashed lines (individual measurements are available in fig. S5). Letters in (B), (D), and (F) denote statistically significant differences among samples as determined by ANOVA followed by Tukey’s HSD test (P < 0.05). Scale bars, 200 μm (A) and 50 μm (C and E).
