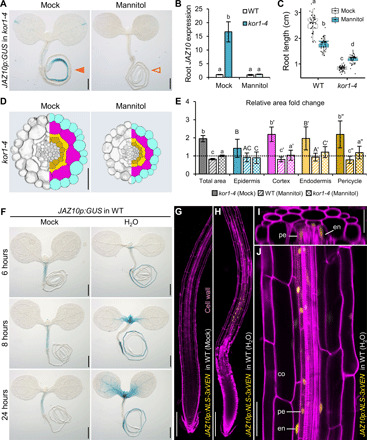
Fig. 5. Osmotic support abolishes constitutive JA production in kor1, while hypoosmotic treatment triggers JA-Ile signaling in WT.

(A) Constitutive JAZ10p:GUS activity in kor1-4 seedlings (orange arrowhead) is abolished following growth in 3% mannitol-supplemented media (empty arrowhead). (B) qRT-PCR of basal JAZ10 root expression of indicated genotypes grown without (mock) or with mannitol. JAZ10 levels were normalized to UBC21. Bars represent the means of three biological replicates (±SD), each containing pools of ~60 5-do roots. (C) Root length box plots of 7-do WT and kor1-4 grown without or with mannitol. Medians are solid lines inside the boxes, and circles depict n = 59 to 61. Mannitol reduced WT root length by −0.78 cm, whereas it increased kor1-4’s by +0.35 cm (linear model, P = 2 × 10⁻⁶). (D) Representative split images from kor1-4 root cross sections (left) and respective cell segmentations (right) grown without or with mannitol. (E) Total and cell-specific area fold change from segmented transversal root sections of WT and kor1-4 grown without or with mannitol. Bars represent mean fold changes of individual cellular areas from 10 roots (±SD), normalized to mock-treated WT indicated by a dashed line (individual measurements are in fig. S6). (F) JAZ10p:GUS expression in WT seedlings submerged in isotonic solution (liquid MS, mock) or deionized water (H2O) for the indicated time. (G to J) JAZ10p:NLS-3xVEN expression in WT roots submerged in (G) mock solution or (H) H2O for 24 hours and counterstained with PI. (I) Orthogonal and (J) longitudinal view from the root early differentiation zone in (H). co, cortex; en, endodermis; pe, pericycle. Letters in (B), (C), and (E) denote statistically significant differences among samples as determined by ANOVA followed by Tukey’s HSD test (P < 0.05). Scale bars, 0.5 mm (A and F), 50 μm (D and J), 200 μm (G and H), and 30 μm (I).
