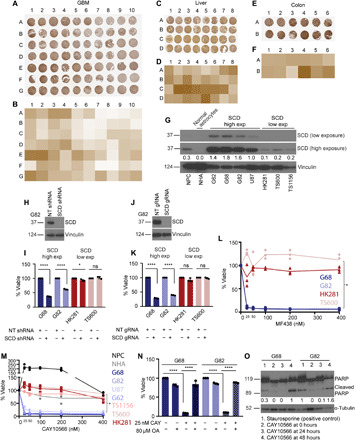
Fig. 1. SCD expression determines sensitivity to SCD inhibition.

(A to F) TMAs showing SCD protein expression and quantification in GBM (A and B), liver cancer (C and D), and colon cancer (E and F). (G) SCD protein in normal human NPCs, NHAs, and patient-derived GBM lines (G62, G68, G82, U87, HK281, TS600, and TS1156). Vinculin was used as loading control. Densitometry for SCD high exposure is shown. (H and J) Western blot (WB) showing SCD knockdown efficiency by shRNA (H) and gRNA (J) in G82 cells. NT, nontarget. Vinculin was used as loading control. (I and K) Viability of high-SCD (G68 and G82) and low-SCD (HK281 and TS600) GBM cells transduced with NT shRNA/gRNA, SCD shRNA (I), or SCD gRNA (K) at 72 hours (n = 3; ****P = <0.0001 and *P = 0.0205). ns, not significant. (L and M) Viability of high-SCD and low-SCD GBM cells in the presence or absence of the SCD inhibitors MF438 (L) or CAY10566 (M) at 72 hours (n = 3; *P < 0.0001). A linear regression model was used to obtain statistical significance. (N) Viability of high-SCD GBM cells (G68 and G82) in the presence or absence of 25 nM CAY10566 and supplemented with or without 80 μM bovine serum albumin–conjugated oleic acid (OA) at 72 hours (n = 3; ****P = <0.0001). (O) WB of high-SCD GBM cells (G68 and G82) showing cleaved PARP protein in staurosporine (positive control) or CAY10566-treated cells. Staurosporine was used for 3 hours. α-Tubulin was used as loading control. Densitometry analysis of bands is shown. The results shown as mean plus SEM. WB represents data from two or three independent experiments. Unprocessed blots are available in fig. S8.
