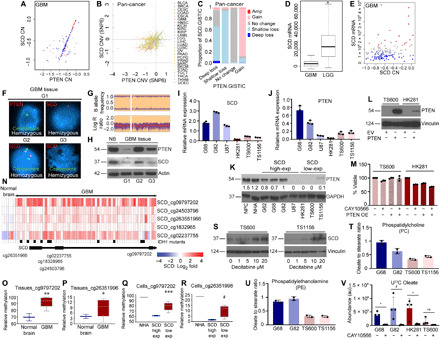
Fig. 3. SCD undergoes co-deletion and epigenetic silencing in GBM.

(A) CNV plot of PTEN and SCD in GBM patients (blue, low; red, high); P < 0.001. (B and C) SCD and PTEN copy number (CN) correlation in PAN cancer; P < 0.001. (D) Box plots showing SCD expression in GBM and LGG, (n = 548 GBM; 534 LGG); *P < 0.001. (E) Correlation of SCD CN and mRNA expression in GBM. (F) FISH analysis of PTEN and SCD in GBM tissues. (G) CNV array showing B allele frequency and log R ratio of SCD (see Materials and Methods). (H) WB showing PTEN and SCD in normal brain (NB) and GBM tissues. (I and J) SCD and PTEN mRNA expression in indicated GBM lines (n = 3). (K) WB and densitometry showing PTEN in indicated cells. (L) WB showing PTEN overexpression in low-SCD GBM cells; EV, empty vector. (M) Viability of cells in (L) with or without 25 nM CAY10566 (n = 3). (N) Heatmap and probe locations showing differential methylation ratio (log2) of SCD in GBM (n = 62) and normal brain (n = 6); black bars, IDH1 mutation. (O to R) Relative methylation of SCD in NB (n = 2) and GBM tissues (n = 8) using the indicated probes [(O) **P = 0.006; (P) *P = 0.09] and in NHA (n = 1) and GBM cells (n = 3 high-SCD and 5 low-SCD lines [(Q) ***P = 0.03; (R) #P = 0.046]. (S) WB showing SCD in low-SCD GBM cells treated with Decitabine. (T and U) Mass spectrometry showing oleate to stearate ratio in phospholipids of two high-SCD (G68 and G82) and two low-SCD (TS600 and TS1156) GBM cells (n = 2). (V) Oleate abundance in two high-SCD and two low-SCD GBM cells with or without 25 nM CAY10566 (n = 4; *P = 0.01, #P = 0.03, and +P = 0.02). Results shown as mean plus SEM. Unprocessed blots are in fig. S8.
