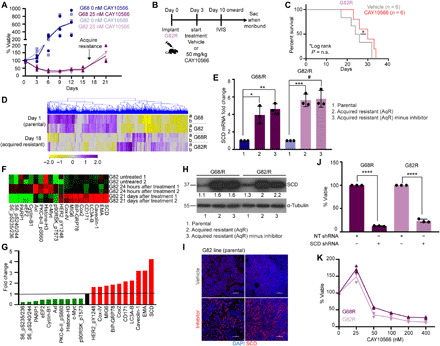
Fig. 4. SCD inhibitor–sensitive lines acquire resistance by overexpressing SCD.

(A) Viability of high-SCD GBM cells (G68 and G82) in the presence or absence of CAY10566 at the indicated days (n = 3). (B and C) Dosing schedule and Kaplan-Meier survival curve of mice transplanted with G82 AqR (G82R) cells. Mice were treated with vehicle or CAY10566. n = 6 per group. P = ns. (D) Heatmap and hierarchical clustering of the DEGs in AqR (G68R and G82R) and parental cells (G68 and G82). Duplicate samples were processed (yellow, low; purple, high expression). (E) qRT-PCR showing fold change in SCD mRNA expression in AqR lines (G68R and G82R) relative to parental lines (G68 and G82), in the presence or absence of CAY10566 for 7 days (n = 3; *P = 0.0005, **P = 0.0069, ***P = 0.001, and #P = 0.0004). (F and G) Heatmap and quantification of RPPA of G82 cells treated with vehicle or 25 nM CAY10566 for 24 hours and 21 days. Green, low; red, high. One and two are duplicate samples. (H) WB showing SCD expression in AqR (G68R and G82R) and parental lines (G68 and G82) in the presence or absence of CAY10566 for 7 days. Densitometry analysis of bands is shown. (I) IHC of tumor tissue using SCD antibody in vehicle- and CAY10566-treated mice. Nuclei were stained with 4′,6-diamidino-2-phenylindole (DAPI). Scale bars, 100 μm. (J and K) Viability of AqR cells expressing NT or SCD shRNA (n = 3; ****P = <0.0001) (J) and in the presence of CAY10566 (n = 3) (K). The results shown as mean plus SEM. WB represent data from two or three independent experiments. Unprocessed blots are available in fig. S8.
