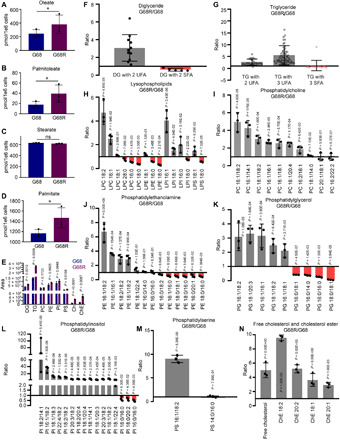
Fig. 5. SCD inhibitor AqR cells undergo lipogenic reprogramming.

(A to D) Untargeted lipidomic analysis showing oleate, palmitoleate, stearate, and palmitate levels in AqR (G68R) and parental (G68) cells (n = 3; *P = 0.05, 0.04, and 0.03, respectively). (E) Lipid levels in parental (G68) compared to AqR (G68R) cells. (PI, phosphatidylinositol; PS, phosphatidylserine; Ch, Cholesterol; ChE, Cholesteryl-ester) (n = 3). (F and G) DG or TG species expressed as ratio of G68R/G68. Each dot represents a DG or TG species with a combination of fatty acids different from the others. Gray, up-regulated; red, down-regulated. (H to M) Phospholipids (gray, up-regulated; red, down-regulated) in AqR (G68R) compared to parental (G68) cells expressed as ratio of G68R/G68. Fatty acids associated with each phospholipid species are shown in X axis. (N) Free cholesterol and cholesteryl-esters up-regulated in AqR (G68R) compared to parental (G68) cells expressed as ratio of G68R/G68. Fatty acids associated with cholesteryl-ester species are shown in X axis. Triplicate samples of G68 and G68R were analyzed.
