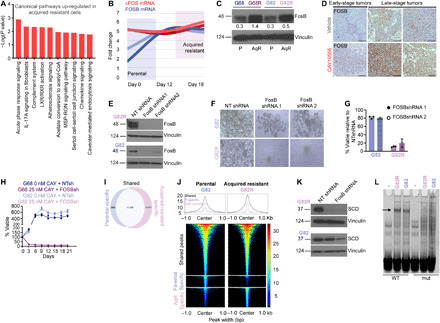
Fig. 6. Chromatin reorganization and FOSB-driven SCD inhibitor acquired resistance in cancer.

(A) Ingenuity pathway analysis of AqR and parental cells (see Materials and Methods). (B) FOSB and cFOS mRNA levels in parental (G68 and G82) and AqR (G68R and G82R) cells at the indicated days. (C) WB showing FOSB levels in parental and AqR cells. Densitometry analysis of bands is shown. (D) IHC using FOSB antibody in early or late stage intracranial tumors of mice treated with vehicle or CAY10566. Scale bars, 200 μm. (E) WB showing FOSB knockdown in G82R and G82 cells. NT, nontarget. (F and G) Bright-field images and viability of parental (G82) or AqR (G82R) cells treated with NT or FOSB shRNA, (n = 3). (H) Viability of parental GBM cells (G68 and G82) in the presence or absence of CAY10566 and FOSB shRNA at the indicated days (n = 3). (I) Venn diagram showing the number of ATAC-seq peaks in parental and AqR cells (see Materials and Methods). (J) Global changes in chromatin accessibility during the parental to AqR transition. Colors indicate the normalized number of sequencing reads. Average density plots are shown at the top. (K) WB showing SCD in NT or FOSB shRNA transduced G82R and G82 cells. (L) EMSA using nuclear extracts from parental (G82) and AqR (G82R) cells. WT or FOSB site mutated (mut) DNA probes from a predicted FOSB binding site in the SCD locus (green highlight) (see fig. S7B); (-) denotes no extract. The arrow indicates loss of binding when putative FOSB site is mutated. WB represents data from two or three experiments. Vinculin was used as loading control. Unprocessed blots are in fig. S8.
