
Fig. 1. ATP-independent DNA compaction mediated by cohesin holocomplex.
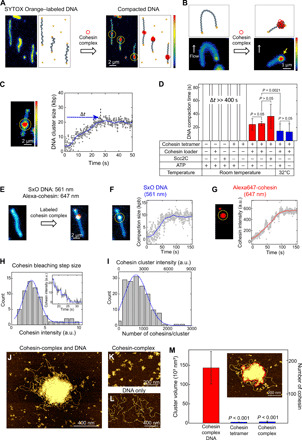
(A) Snapshots before and after cohesin-induced compaction of a doubly tethered DNA molecule. In schematics on the right, blue represents DNA, yellow represents biotin-streptavidin, and red represents the cohesin holocomplex. (B) Snapshots and schematics of side-flow experiment before and after addition of cohesin complexes. Yellow arrow indicates a DNA region that is tightly clustered (i.e., not a DNA loop). (C) DNA cluster size as a function of time (right) calculated from the integrated fluorescence intensities in the cluster and the full 48.5-kbp λDNA in the image (left). Yellow circle indicates the compaction spot. (D) DNA compaction time under various conditions (n = 33, 25, 10, 13, 10, 13, 7, 11, and 9, respectively). (E) Cluster formation with labeled cohesin holocomplex showing the colocalization of compacted DNA (blue) and cohesin (red). (F) Representative measured trace of DNA compaction. (G) Simultaneously measured cohesin binding trace. (H) Histogram of bleaching step intensities of single Alexa647-cohesin molecules (n = 64). Inset shows a representative bleaching trace of a small cluster. A Gaussian fit (blue) yielded 3.0 ± 1.2 arbitrary units (a.u.) (means ± SD). (I) Number of cohesin holocomplexes in a cluster. A Gaussian fit (blue) yielded 740 ± 500 (means ± SD). (J to L) Atomic force microscopy (AFM) images of DNA/cohesin-holocomplex, cohesin-holocomplex only, and DNA only, respectively. (M) Volumes of the DNA/cohesin clusters for different conditions (median ± SEM; n = 21, 11, and 57). Red line in inset illustrates a cluster with its boundary (red). Two-paired Student’s t test was used for (D) and (M).