
Fig. 2. Cohesin holocomplex forms liquid droplets along DNA.
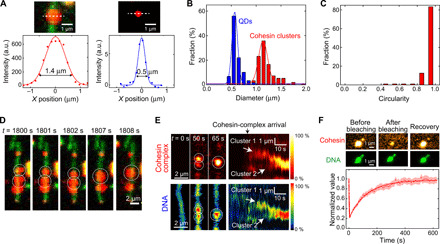
(A) Images of a DNA/cohesin-holocomplex droplet (top left) and 20-nm QD (top right). White dashed lines indicate where cross-sectional intensity profiles were acquired, yielding the bottom panels with Gaussian fits. (B) Diameter distributions of cohesin droplets (means ± SD, 1.14 ± 0.18 μm; n = 151) and QDs (means ± SD, 0.57 ± 0.11 μm; n = 59). (C) Circularity distributions of cohesin droplets (n = 57). (D) Cohesin holocomplex (red) forms liquid-phase droplets along a DNA (green). Over time, two droplets are seen to fuse into one spherical droplet (movie S4). (E) Merging of two clusters, as monitored in the cohesin (top) and DNA (bottom) channels. Left shows three snapshots; right shows fluorescence intensity kymographs (n = 18). (F) Fluorescence recovery after photobleaching (FRAP) experiment of cohesin droplet. Snapshot images of a cohesin droplet on DNA, before and after photobleaching and after recovery (top). Cohesin cluster intensity versus time (bottom; mean ± SEM, n = 44). Time constant is 126 ± 4 s (error is SD).