
Fig. 3. Reversibility of the cohesin-DNA droplet formation.
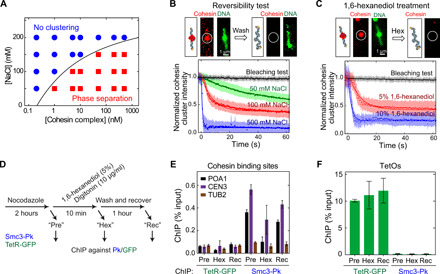
(A) Phase diagram of cluster formation induced by cohesin holocomplex and λDNA at various salt (NaCl) and cohesin-holocomplex concentrations. Red squares indicate that DNA compaction occurred, while blue circles indicate that this did not occur. Solid line is a guide to the eye. (B) Reversibility test with washing in a high-salt buffer. Cohesin cluster intensities versus time upon washing with buffers with different salt concentrations (bottom; errors are SD). Dissociation times (τ) are 476 ± 25 s, 41.9 ± 0.7 s, 7.5 ± 0.2 s, and 0.79 ± 0.03 s (errors are SD) for bleaching, 50, 100, and 500 mM NaCl, respectively (n = 60, 113, 93, and 150). (C) Dissolving of a cohesin cluster by washing with 1,6-hexanediol. Cohesin-cluster intensity versus time upon washing with 1,6-hexanediol (bottom). τ = 476 ± 25 s, 7.9 ± 0.1 s, and 2.2 ± 0.1 s for bleaching, 5 and 10% 1,6-hexanediol buffer, respectively (n = 60, 80, and 37). (D) Scheme for in vivo 1,6-hexanediol treatment of yeast cells. (E) Chromatin immunoprecipitation–quantitative real-time polymerase chain reaction (ChIP-qPCR) results for cohesin (Smc3-Pk) and binding to a centromere (CEN3), chromosome arm (POA1), and a negative-control binding site (TUB2), before (Pre) and after 1,6-hexanediol (Hex) treatment and after washing out 1,6-hexanediol (Rec) (means ± SEM, n = 3). Tetracyclin repressor–green fluorescent protein (TetR-GFP) binding was analyzed as a control. (F) Same for binding to tetracyclin operator (TetO) sites (means ± SEM, n = 3).