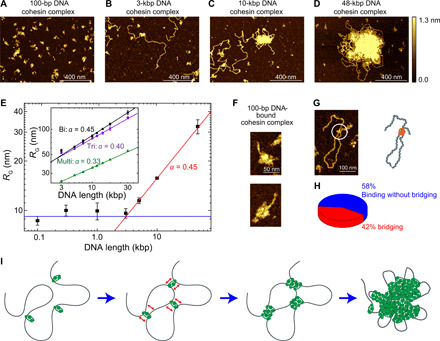
Fig. 4. AFM imaging of DNA-mediated cohesin clusters and BIPS model.

(A to D) Representative AFM images of cohesin holocomplex as it binds to different DNA lengths of 100 bp, 3 kbp, 5 kbp, and 48.5 kbp, respectively. (E) Radius of gyration of cohesin-DNA clusters versus DNA length (median ± SEM). Note the log-log scale. At low DNA length l, the cluster size is constant (green line), while beyond a critical length lC ≈ 3 kbp, the data exhibit a power law, RG~lα (blue line) with α = 0.45 ± 0.01 (SD) from a fit. Inset shows data from molecular dynamics (MD) simulations for cohesin with biconnectivity (black, α = 0.45 ± 0.01), triconnectivity (violet, α = 0.40 ± 0.01), and multiconnectivity (green, α = 0.33 ± 0.01). (F) Examples of single cohesin holocomplex bound to 100-bp DNA. (G) Representative image of DNA bridging by a single cohesin holocomplex. (H) Probability that a single cohesin holocomplex that bound DNA did or did not bridge to another segment along the DNA (n = 81). (I) Working BIPS model for cohesin-mediated phase separation. Bare DNA is bridged by a single cohesin holocomplex, increasing the local concentration of DNA, which subsequently induces binding of more cohesin holocomplexes to this region, leading to the formation of a large DNA/cohesin-holocomplex droplet. The cartoons are not drawn to scale.
