
Fig. 2. Angiogenic activity of various polymers.
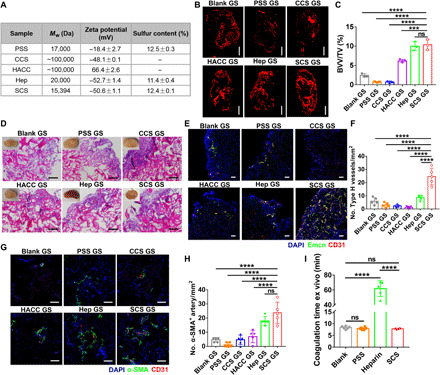
(A) Characterization of the polymers by zeta potential analysis and elemental analysis. (B and C) Representative angiographic images (B) and quantification of relative blood vessel volume (BVV/TV) (C) in implants at day 7, respectively (n = 3). Scale bars, 1 mm. (D) H&E staining of implants at day 7 in mice ischemic hind limb. Scale bars, 100 μm. Insets are macroscopic views of the indicated implants. Photo credit: Y.Y., East China University of Science and Technology. (E to H) Representative immunostained images (E and G) with quantification of CD31hiEmcnhi (Type H) endothelium (F) and α-SMA+ arteries (H) in implants on day 7 after implantation in ischemic limb (n = 5). Scale bars, 100 μm. (I) Measurement of ex vivo anticoagulation; 2 μg of PSS, heparin, or SCS was added into 200 μl of blood plasma from rabbit at 37°C (n = 6). Data are means ± SD. ***P < 0.05 and ****P < 0.001; ns, not significant [(C), (F), and (H), one-way ANOVA compared to SCS GS with Dunnett’s post hoc test; (I), one-way ANOVA compared to heparin with Dunnett’s post hoc test].