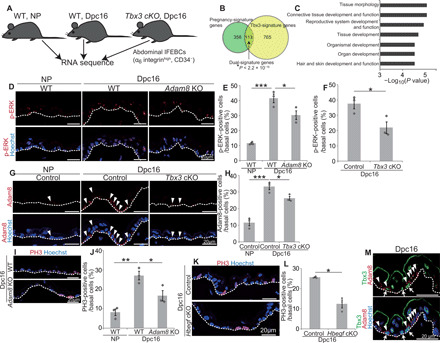
Fig. 1. Tbx3+-BCs shape EPCs in expanding abdominal epidermis of pregnant mice.

(A) Experimental design for RNA-seq. (B) Venn diagram of pregnancy and Tbx3 signature genes. *P < 2.2 × 10⁻¹⁶ analyzed by Fisher’s exact test. (C) GO analysis of dual signature genes (113 genes). (D and E) Staining and quantification of p-ERK+–BCs in abdominal epidermis (n > 150 cells, three mice). (F) Quantification of p-ERK+–BCs (n > 150 cells, three mice). (G and H) Staining and quantification of Adam8+-BCs (n > 140 cells, three mice). (I and J) Staining and quantification of PH3+-BCs (n > 190 cells, three mice). (K and L) Staining and quantification of PH3+-BCs (n > 100 cells, three mice). (M) Tbx3/Adam8 staining in abdominal epidermis. Arrows indicate Tbx3+-BCs. Arrowheads indicate ADAM8+-BCs. (E, F, H, J, and L) Error bars show SEM. *P < 0.05, **P < 0.01, and ***P < 0.001 by Dunnett’s multiple comparison test (E, H, and J) and the two-tailed Student’s t test (F and L). (D, G, I, K, and M) White dashed lines indicate basement membranes (BMs).
