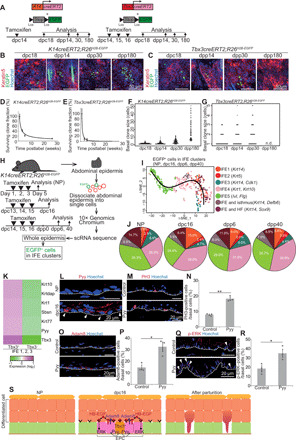
Fig. 2. Tbx3+-BCs undergo differentiation to be eliminated from the epidermis after parturition.

(A) Tracing K14cre- and Tbx3cre-labeled clones. (B and C) Whole-mount images of K14cre- and Tbx3cre-labeled clones in abdominal epidermis in tamoxifen-treated K14creERT2;R26H2B-EGFP and Tbx3creERT2;R26H2B-EGFP mice. (D and E) Quantification of clone survivability. (F and G) Distribution of the basal clone size. n.d., not detected. (H) Experimental design for scRNA-seq. (I) Pseudo-time reconstruction of differentiation of EGFP+ cells in IFE clusters. (J) Pie charts of the IFE clusters. (K) Heatmap of the Tbx3+ cell–enriched genes in IFE1 to IFE3 clusters. (L) Pyy staining in abdominal epidermis. Arrowheads indicate Pyy+-BCs. (M and N) Staining and quantification of PH3+-BCs in abdominal epidermis of control and Pyy-injected NP mice (n > 140 cells, three mice). (O and P) Staining and quantification of Adam8+-BCs (n > 170 cells, three mice). (Q and R) Staining and quantification of p-ERK+–BCs (n > 130 cells, three mice). (S) Schematic of EPCs. (D to G, N, P, and R) Error bars indicate SEM. (N, P, and R) *P < 0.05 and **P < 0.01, by two-tailed Student’s t test. (L, M, O, and Q) White dashed lines indicate BMs.
