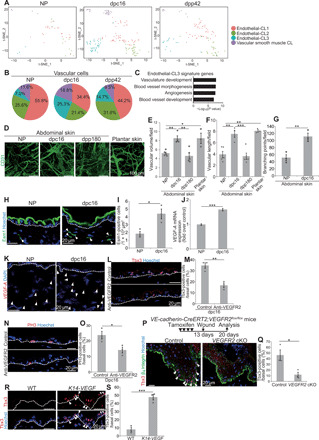
Fig. 4. Vasculatures induce Tbx3+-BCs.

(A) t-SNE plots for vascular cluster cells (NP, n = 43; dpc16, n = 154; dpp42, n = 95). (B) Pie charts of the vascular subclusters. (C) GO analysis of endothelial-CL3 signature genes. (D) Whole-mount images of CD31 (Lyve1−) in abdominal and plantar dermis. (E and F) Quantification of vascular volume and length (n > 3 areas, three mice). (G) Quantification of vascular branching points (n = 3 areas, three mice). (H and I) Staining and quantification of dermal Esm1+ cells (n > 10 areas, three mice). (J) VEGF-A quantitative reverse transcription polymerase chain reaction (qRT-PCR) (n = 4). (K) VEGF-A fluorescence in situ hybridization (FISH). DAPI, 4cence in situ hybridization ( (L and M) Staining and quantification of Tbx3+-BCs in control and anti-VEGFR2–injected abdominal skin at dpc16 (n > 200 cells, three mice). (N and O) Staining and quantification of PH3+-BCs (n > 200 cells, three mice). (P) Tbx3/β4 integrin staining in wounded back skin of control and VEGFR2 cKO mice. Arrowheads indicate Tbx3+-BCs. (Q) Quantification of Tbx3+-BCs (n > 100 cells, three mice). (R and S) Staining and quantification of Tbx3+-BCs (arrowheads) in WT and K14-VEGF back skin (n > 200 cells, three mice). (E, F, G, I, J, M, O, Q, and S) Error bars show SEM. *P < 0.05, **P < 0.01, and ***P < 0.001, by Tukey’s multiple comparison tests (E and F) and two-tailed Student’s t test (G, I, J, M, O, Q, and S). (H, K, L, N, and R) White dashed lines indicate BMs.
