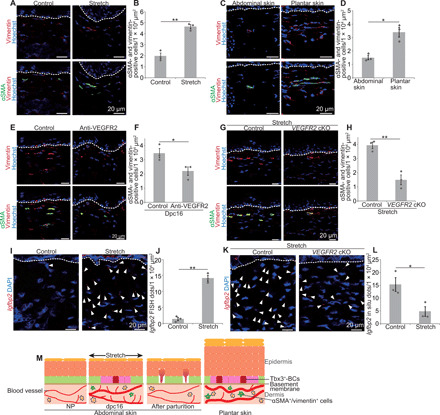
Fig. 6. Vasculatures induce dermal-to-epidermal signals.

(A and B) Staining and quantification of dermal αSMA+/vimentin+ cells in the abdominal skin under control or stretched conditions. (C and D) Staining and quantification of dermal αSMA+/vimentin+ cells in the abdominal and plantar skin (n > 10 areas, three mice). (E and F) Staining and quantification of dermal αSMA+/vimentin+ cells in control and anti-VEGFR2–injected abdominal skin at dpc16 (n > 10 areas, three mice). (G and H) Staining and quantification of dermal αSMA+/vimentin+ cells in the abdominal skin of control and VEGFR2 cKO mice under stretched conditions (n > 10 areas, three mice). (I) Igfbp2 FISH in control or stretched abdominal skin. (J) Quantification of Igfbp2 FISH dots (n > 4 areas, three mice). (K) Igfbp2 FISH in the abdominal skin of control and VEGFR2 cKO mice under stretched conditions. (L) Quantification of Igfbp2 FISH dots (n > 4 areas, three mice). (M) Summary illustrating vasculature-induced EPC formation in the dynamic skin. (B, D, F, H, J, and L) Error bars indicate SEM. *P < 0.05 and **P < 0.01, by two-tailed Student’s t test. (A, C, E, G, I, and K) White dashed lines indicate BMs.
