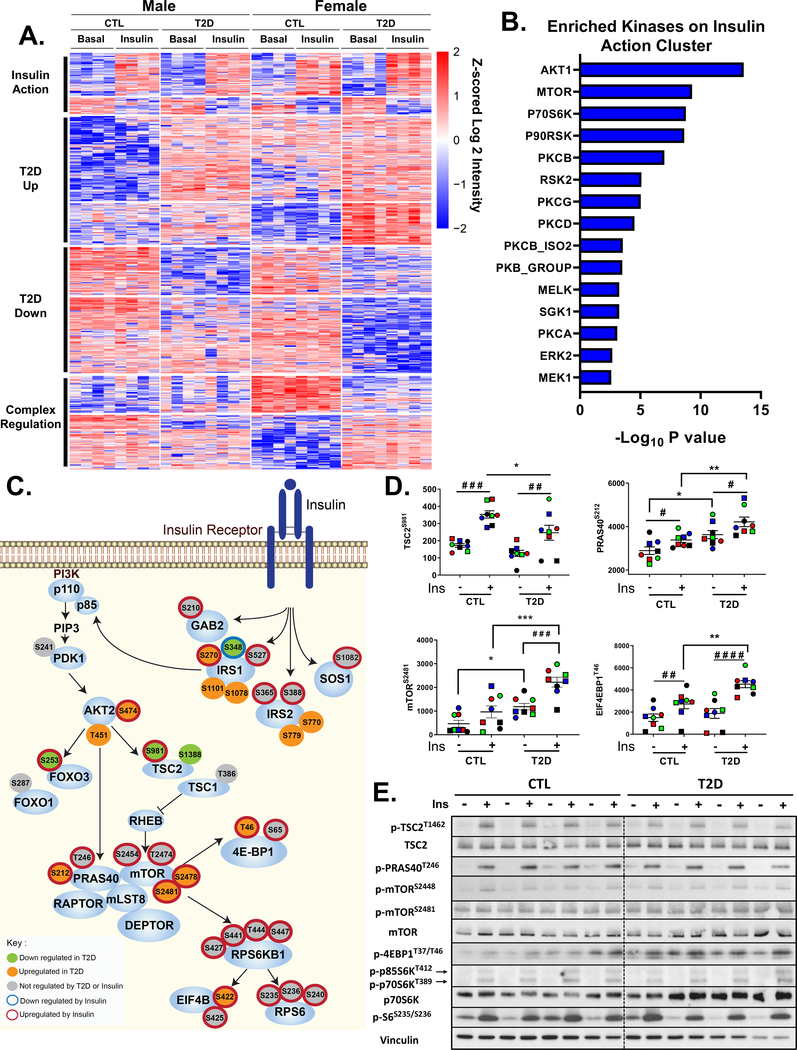
Figure 3. Phosphoproteomics Reveals Dysregulation of IRS/AKT/mTOR Signaling Nodes in T2D iMyos.
(A) Hierarchical clustering of the phosphopeptides showing the effects of insulin and T2D on the phosphoproteome. Rows are Z-scores of log2 transformed intensity of phosphosites for each sample (columns). See also Figure S3 and Table S1. (B) Overrepresented protein kinases within insulin action cluster (P < 0.01). (C) Representation of IR signaling pathway showing proximal and downstream phosphorylation events. Each of the phosphosites were color coded based on the effects of insulin or T2D on phosphorylation, Two-way ANOVA (P < 0.05). (D) Phosphosite quantification of mTORC1 signaling components. Data are means ± SEM of phosphosites intensity values (x105). # P < 0.05, ### P < 0.001, #### P < 0.0001 basal vs insulin, * P <0.05, ** P <0.01, *** P < 0.001 CTL vs T2D, Two-way ANOVA. (E) Validation of phosphoproteomics by immunoblot in iMyos from male subjects. See also Figure S4

