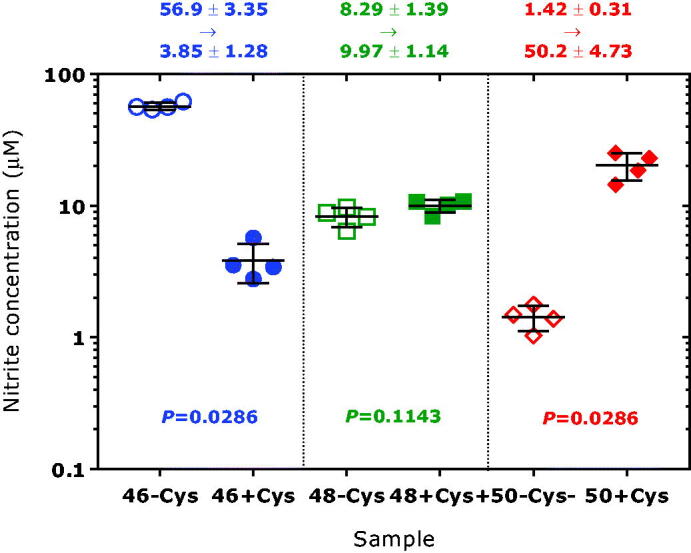
Figure 2.

Concentrations of the nitrite species (left panel) 16 O = N-16O‒, (middle panel) 16 O = N-18O‒ and 18 O = N-16O‒, and (right panel) 18 O = N-18O‒ upon incubation of sodium nitrite (100 µM) with bovine erythrocytic CA II (5 mg/mL, 172 µM) in 100 mM Tris buffer, pH 7.4, prepared in 18 O-water (>98% 18 O) in the absence of L-cysteine (-Cys) or in the presence of L-cysteine (+Cys) at 100 µM. The experiment was performed as described elsewhere3. Data are shown as mean with standard deviation from four independent incubations. Statistical analysis was performed by one-way ANOVA and Mann-Whitney test.
