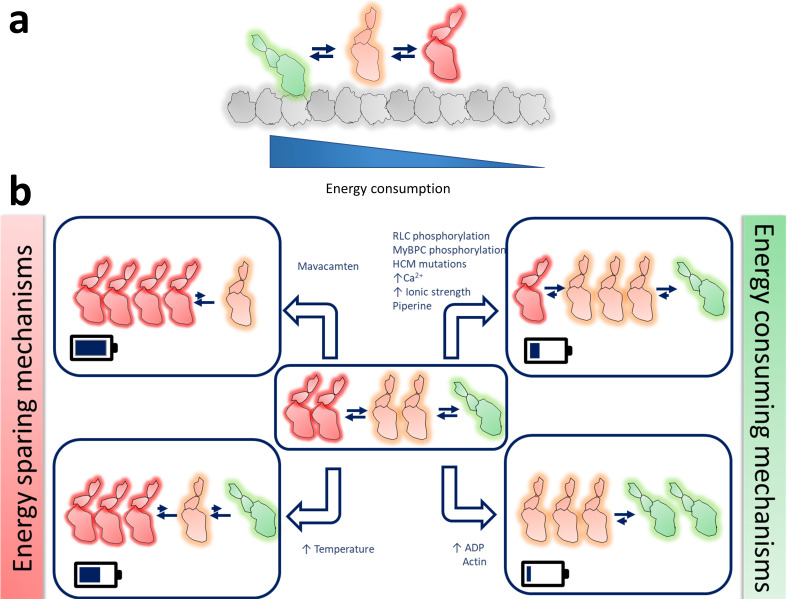
Figure 2. Schematic representation of the possible different functional states of myosin.
(a) Different states of myosins are arranged in the order of their energy utilization- actin-bound myosin in green, DRX myosin in orange, and SRX myosin in red. (b) Graphical representation of how different physiological, pathophysiological, and non-physiological perturbations, as listed, alter the myosin population in these three different states. The small blue arrows next to the different perturbations denote an increase of those parameters. The battery symbol in each box qualitatively resembles the energy saved by the system in each scenario.

