
Figure 2.
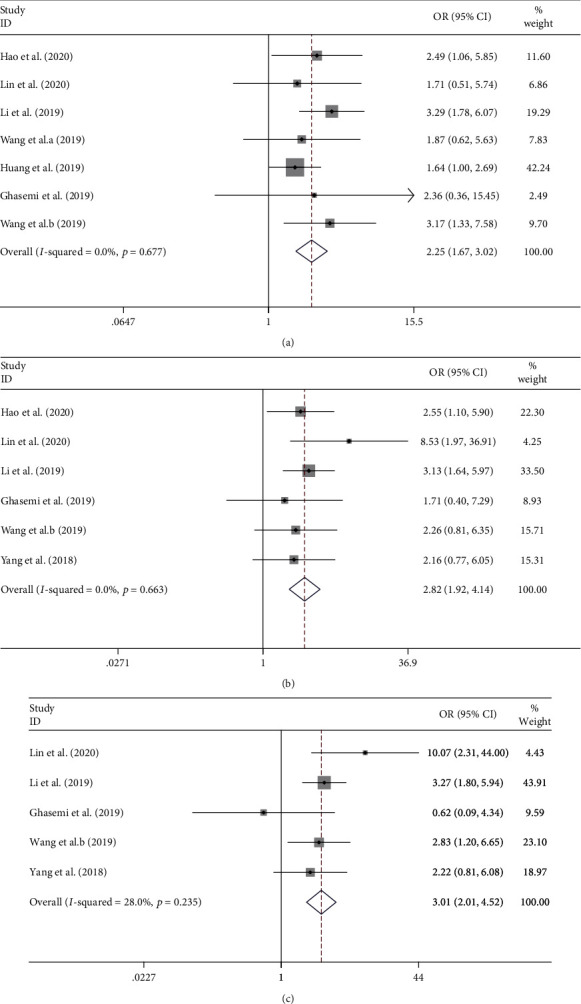
Forest plots of odds ratios (ORs) for the association between circ-ITCH expression and lymph node metastasis (LNM) (a), TNM stage (b), and tumor size (c). The grey squares and horizontal lines denote the study-specific ORs and 95% CIs, respectively. The area of the squares represents the weight (inverse of the variance) of each study. The diamond represents the pooled OR and 95% CI.