
Figure 2.
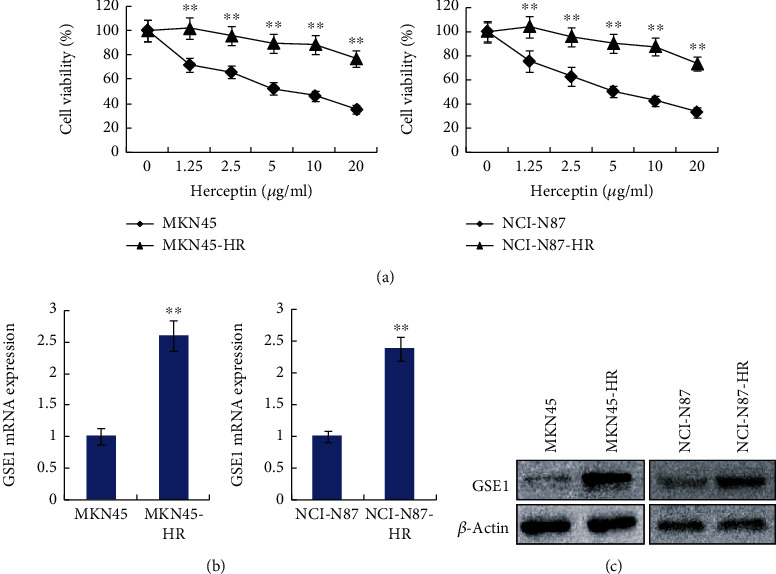
Trastuzumab-resistant gastric cancer cells expressed higher GSE1. (a) Cell growth curves of MKN45-HR, MKN45, NCI-N87-HR, and NCI-N87 cells under different doses of trastuzumab were examined by MTT assay. (b) mRNA levels of GSE1 in MKN45-HR, MKN45, NCI-N87-HR, and NCI-N87 cells were examined by RT-qPCR. GAPDH was used as a control. (c) Protein levels of GSE1 in MKN45-HR, MKN45, NCI-N87-HR, and NCI-N87 cells were examined by western blotting. β-Actin was a negative control. ∗∗P < 0.01.