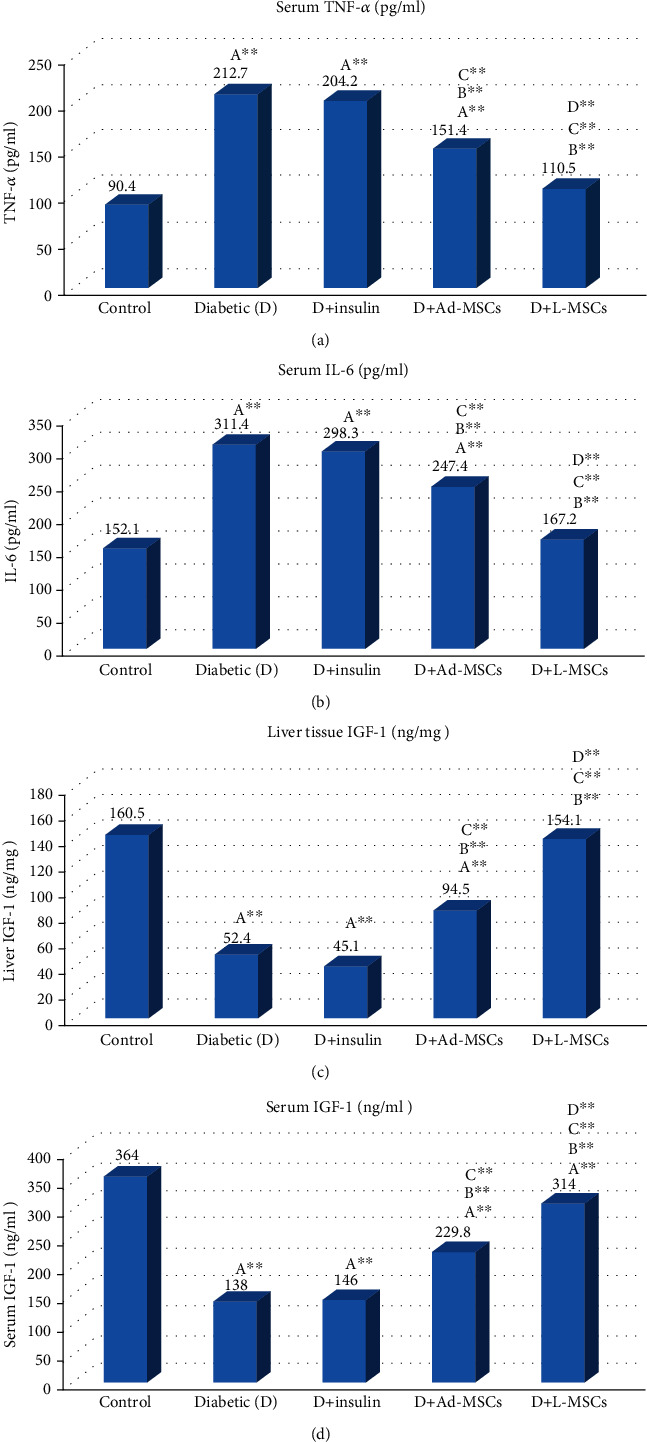
Figure 1.

Evaluation of inflammatory markers including TNF-α (pg/ml) (a), IL-6 expression (pg/ml) (b), liver tissue IGF-1 (ng/mg) (c), and serum IGF-1 (ng/ml) (d) in all the studied groups. Statistically significant differences are indicated as follows: Asignificant compared to the control group; Bsignificant compared to the control diabetic group; Csignificant compared to the insulin group; Dsignificant compared to the Ad-MSC group.
