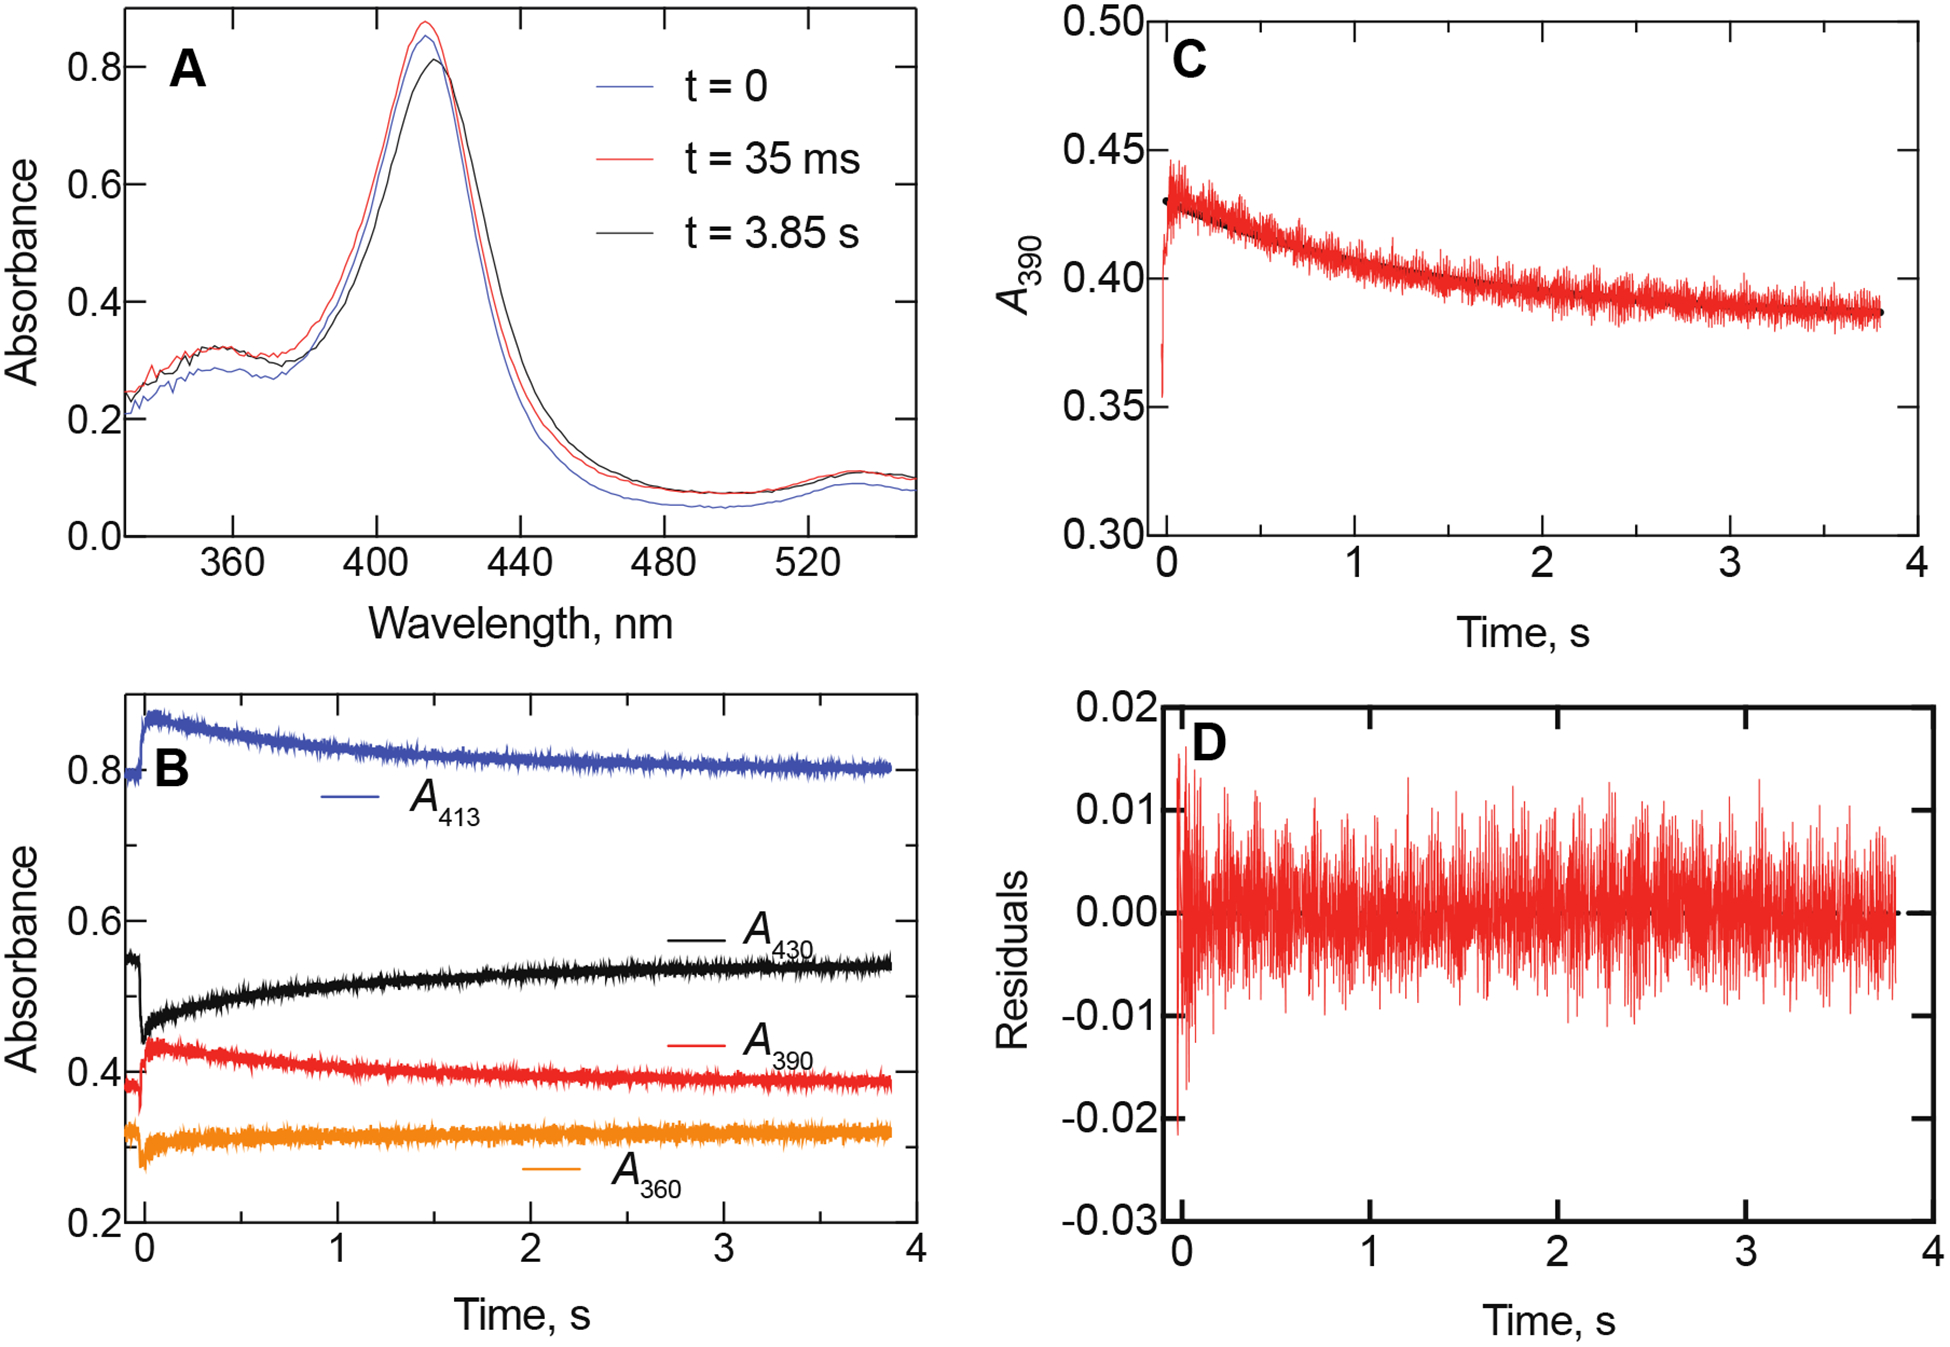
Figure 4.

Spectral changes observed in reaction of (S)-orteronel with P450 17A1. The P450 concentration was 2 μM and the (S)-orteronel concentration was 20 μM (final concentrations in observation cell). A total of 4,000 spectra was collected over a period of 4 s. (A) The spectra are shown at times 0, 35 ms, and 3.85 s. Compare with Figure 3A. (B) Kinetic traces are shown for different wavelengths. Note the opposite directions of the changes following mixing and the gradual changes following the initial response. (C) Plot of ΔA390 changes. The rate of the initial increase was 60 ± 7 s−1 and the second (decrease) was 0.88 ± 0.04 s−1. (D) Residuals trace for plot and rate estimates in Part D.
