Fig. 1.

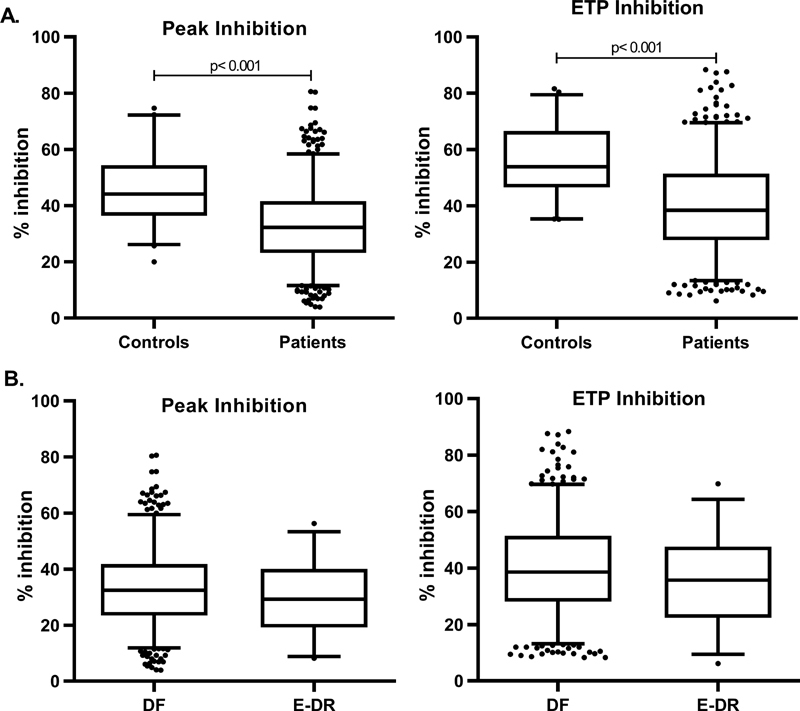
Endogenous thrombin generation potential inhibition and peak inhibition ( A ) in patients compared with controls and ( B ) in patients with E-DR compared with DF. E-DR, early disease recurrence; DF, disease free.

Endogenous thrombin generation potential inhibition and peak inhibition ( A ) in patients compared with controls and ( B ) in patients with E-DR compared with DF. E-DR, early disease recurrence; DF, disease free.