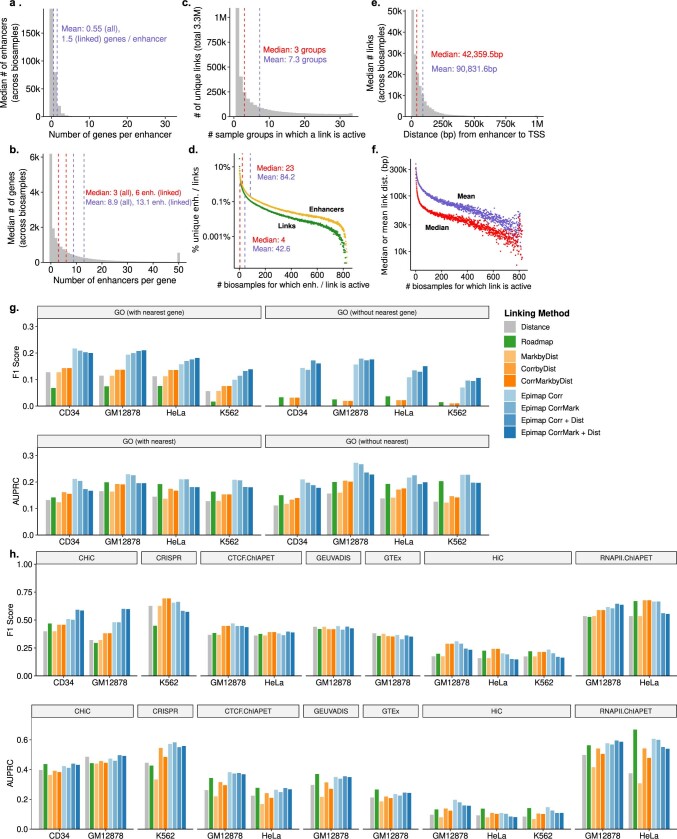
Extended Data Fig. 8. Linking statistics and validation.
a–f, Enhancer-gene linking statistics. a, Bar chart of median number of genes per enhancer per bin across biosamples. b, Bar chart of median number of enhancers per gene per bin across biosamples. c, Total number of sample groups in which a unique link is active, out of 3.3M unique links. d, Per cent of unique elements (enhancers or links) for which the element is active in a given number of biosamples. e, Median distance between the enhancer and TSS of a link per distance bin across biosamples. f, Mean or median link distance for all enhancers active in a given number of biosamples. All means represented by blue dashed lines and text and medians by red dashed lines and text. g, h, Comparison (prediction F1 score and AUPRC) of gene-enhancer link predictions (blue) with distance, activity by distance, correlation by distance, correlation and activity by distance, and Roadmap Epigenomic links on functional gene set-based links (g) and physical, genetic, and perturbation-based links across four cell lines (h).

