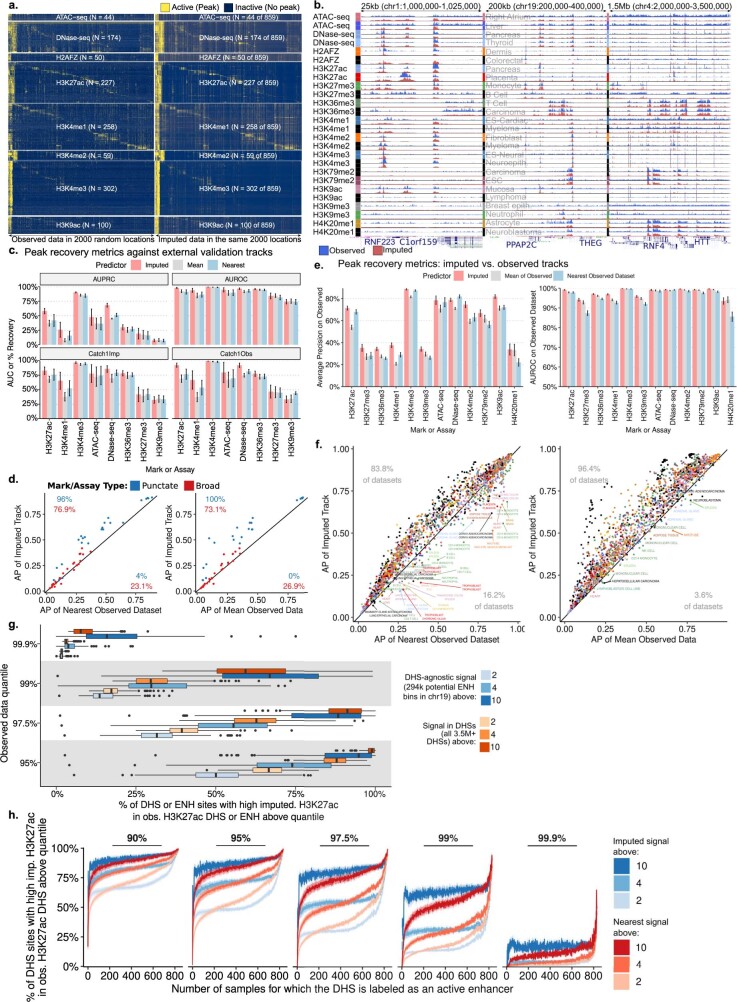
Extended Data Fig. 1. Imputation validation.
a, Heat map of paired observed and imputed signal intensity across all punctate Tier 1 and Tier 2 assays across 2000 highest-max-signal bins among 5000 randomly-selected 25bp bins. Samples (rows) and bins (columns) are clustered and diagonalized using maximum imputed signal intensity, with broadly-active regions shown first. b, Paired observed (blue) and imputed (red) tracks for all Tier 1 and Tier 2 assays in three regions at different resolutions for randomly-selected samples. Each row shows a single track across three different resolutions. Full tracks at https://epigenome.wustl.edu/epimap. c, Genome-wide imputation performance metrics for predicting 51 external validation tracks across 8 assays in 14 biosamples (average precision, AUROC predicting top 1% of observed data and peak recovery of top 1% Imputed or Observed with top 5% Observed or Imputed, respectively) in chr1, shown for either the appropriate imputed track, the best-matching of the other observed tracks, or the observed signal average. d, Scatter comparison of average precision (AP) of imputed data with either nearest observed track or signal average in punctate (blue) and broad (red) marks. e, Genome-wide imputation performance metrics (AP, AUROC) for predicting observed tracks (evaluated on all observed tracks with an imputed prediction) in chr19, shown for either the appropriate imputed track, the best-matching of the other observed tracks, or the observed signal average. f, Scatter comparison of average precision (AP) of imputed data with either nearest observed track or signal average across all datasets, coloured by sample group. Cases where the nearest sample or the mean heavily outperformed the imputation are labelled (points with over 25%, for nearest, or 10%, for mean, greater average precision than the imputed track). g, Sample-specific percentage of the 2M DHSs with imputed H3K27ac above a certain cut-off that are also in the top 10%, 5%, 2.5%, 1%, and 0.1% of 3.6M DHSs by matched observed datasets. h, Sample-specific percentage of the 2M DHSs with imputed (blue) or nearest observed (red) H3K27ac above a certain cut-off that are also in the top 10%, 5%, 2.5%, 1%, and 0.1% of 3.6M DHSs by matched observed datasets, partitioning the DHSs by the number of samples in which each DHS is called as an active enhancer.

