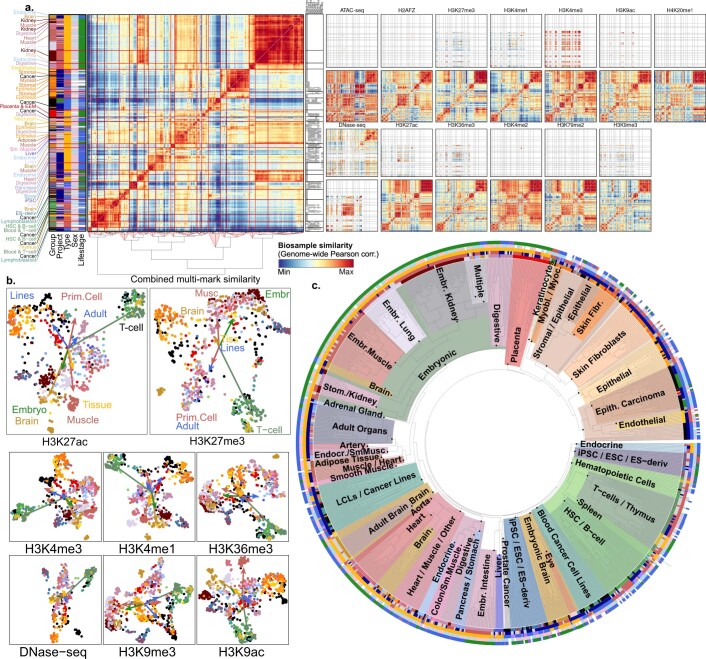
Extended Data Fig. 2. Cross-sample relationships.
a, Hierarchically clustered genome-wide correlation across samples in all 13 imputed Tier 1 and 2 assays. Observed (top) vs. imputed (bottom) matrices shown. Clustering conducted on the fused matrix (left panel, constructed as in main figure). Observed data availability matrix (grey is available, white is unavailable) is shown for the top nine marks and accessibility assays by number of observed datasets. b, Two-dimensional embeddings of Tier 1 and 2 marks coloured by tissue group, using Spearman correlation within matched chromatin states. Arrows point from the centre of mass of all biosamples to that of the specified group. c, Hierarchical clustering of 833 biosamples based on enhancer activity distances (Supplementary Fig. 12). Subtrees enriched for specific sample types are highlighted and labelled (colours). Samples are labelled by metadata in the outer ring (Supplementary Table 1).

