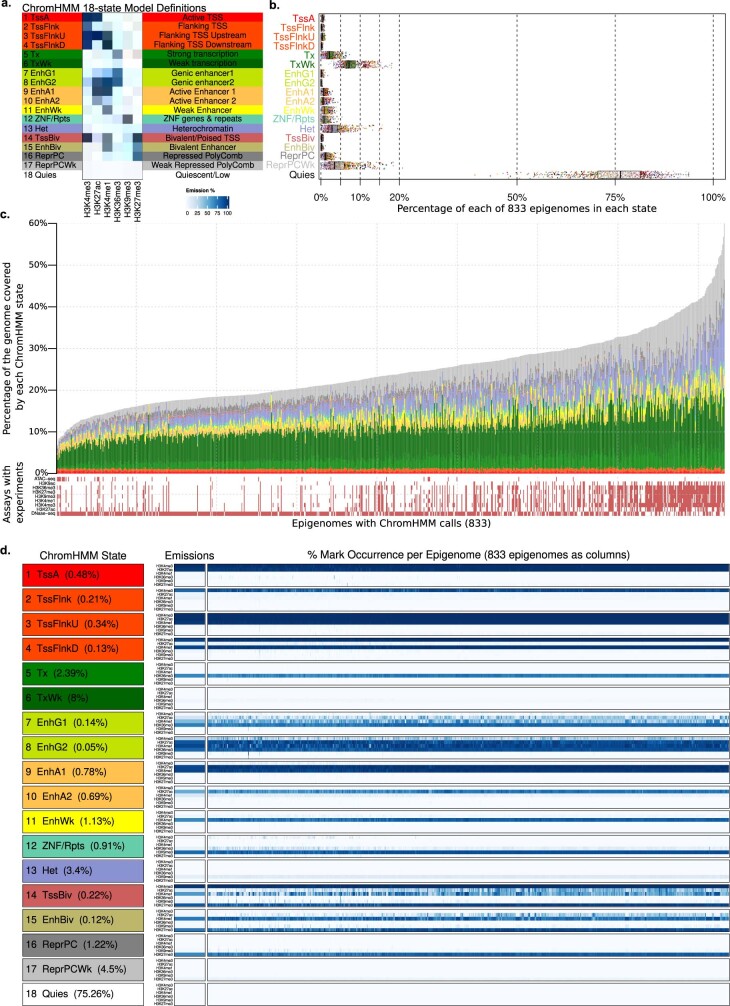
Extended Data Fig. 3. Chromatin states.
a, Epigenomic state mnemonics for ChromHMM 18-state model (left) with emissions matrix (centre) and state definitions (right). The 18-state model was trained on Roadmap data for the Roadmap 2015 paper. b, Distributions of per-state genome coverage (box-plots) across 833 biosamples (points, coloured by tissue group) according to the ChromHMM 18-state model annotations. c, Genome coverage for each 18-state-model ChromHMM state across 833 biosamples after QC. Lower panel shows availability of 9 top marks, ordered by the number of observed datasets. Biosamples are ordered by per cent of the genome not annotated as quiescent. d, Comparison of per state (left panel) model emissions (middle panel) against mark occurrence in state calls (right panel) across 833 biosamples (columns in right panel). Observed occurrence matched the emissions closely, with three exceptions, corresponding to bivalent chromatin states and transcribed enhancers (cumulatively covering 0.48% of the genome on average), which showed discrepancies for 12.1% of biosamples on average, likely stemming from their low frequency in the genome, and the frequent co-occurrence of H3K27ac and H3K4me1.

