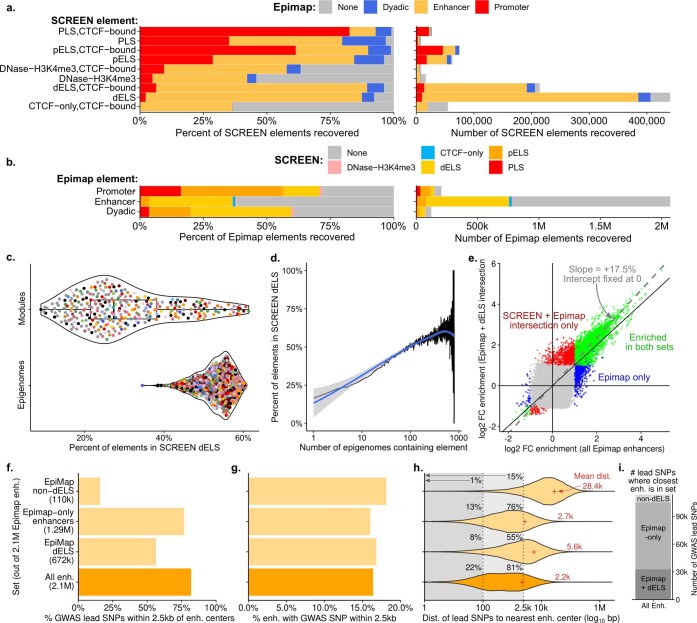
Extended Data Fig. 4. Comparison with SCREEN.
a, Recovery of each category of SCREEN elements by each category of EpiMap elements, percentage (left) and number (right). b, Recovery of each category of EpiMap elements by each category of SCREEN elements, percentage (left) and number (right). c, Percentage of EpiMap enhancers in dELS in each of 300 modules and 833 epigenomes. d, Percentage of EpiMap enhancers in dELS by number of epigenomes containing element (blue line represents loess smooth). e, Comparison of motif-module log2 fold change enrichments for all enhancers and for the intersection of enhancers and dELS. f–i, Comparison of enhancer sets within EpiMap enhancers (intersections with dELS, non-dELS, unique, and all enhancers), showing percentage of 113k pruned GWAS catalogue lead SNPs within 2.5kb of enhancer centres (f), per cent of enhancers with a GWAS SNP within 2.5kb of their centre (g), the distribution of distances of GWAS SNPs to their nearest enhancer within each set (h), and the number of SNPs for which the nearest enhancer fell into each of the constituent sets (i).

