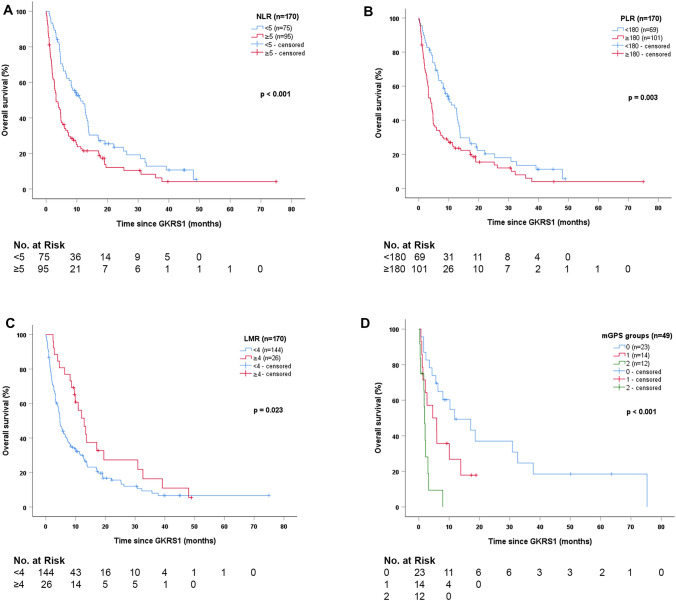
Fig. 2.
Survival after radiosurgery stratified according to prognostic scores. a The estimated survival after GKRS1 was significantly longer in patients with NLR < 5 (75/170, 44%; 11.3 months, 95% CI = 7.0–15.5) than in patients with NLR ≥ 5 (95/170, 56%; 3.3 months, 95% CI = 1.8–4.7; p < 0.001). b The estimated survival after GKRS1 was significantly longer in patients with PLR < 180 (69/170, 41%; 10.9 months, 95% CI = 6.9–14.8) than in patients with PLR ≥ 180 (101/170, 59%; 4.3 months, 95% CI = 3.1–5.6; p = 0.003). c The estimated survival after GKRS1 was significantly longer in patients with LMR ≥ 4 (26/170, 15%; 12.9 months, 95% CI = 9.3–16.5) than in patients with LMR < 4 (144/170, 85%; 4.7 months, 95% CI = 3.8–5.6, p = 0.023). d Patients with a mGPS score of 0 (23/49, 47%) showed the longest estimated median survival after GKRS1 with 11.8 months (95% CI = 0.2–23.3), followed by patients with mGPS of 1 (14/49, 29%) with 4.6 months (95% CI = 0.0–10.4), and mGPS of 2 (12/49, 24%) with 1.9 months (95% CI = 1.4–2.4; p < 0.001). Additional pairwise comparisons revealed significant differences in survival between mGPS scores 0 and 2 (p < 0.001) and between mGPS scores 1 and 2 (p = 0.022), even after Shaffer correction for multiple testing. Patients with a mGPS score of 0 only showed a tendency towards a longer survival after GKRS1 compared to patients with a mGPS score of 1 (p = 0.075). Thus, patients with poor mGPS scores, defined as mGPS 1 and 2, were pooled together. The comparison between mGPS score of 0 (23/49, 47%; 11.8 months; 95% CI = 0.2–23.3) and pooled mGPS score of 1 and 2 (26/49, 53%; 2.2 months; 95% CI = 1.2–3.2) additionally revealed significant differences in survival after GKRS1 (p = 0.002). CI confidence interval, GKRS Gamma Knife Radiosurgery, LMR Lymphocyte-to-Monocyte-Ratio, mGPS modified Glasgow Prognostic Score. NLR Neutrophil-to-Lymphocyte Ratio, PLR Platelet-to-Lymphocyte-Ratio

