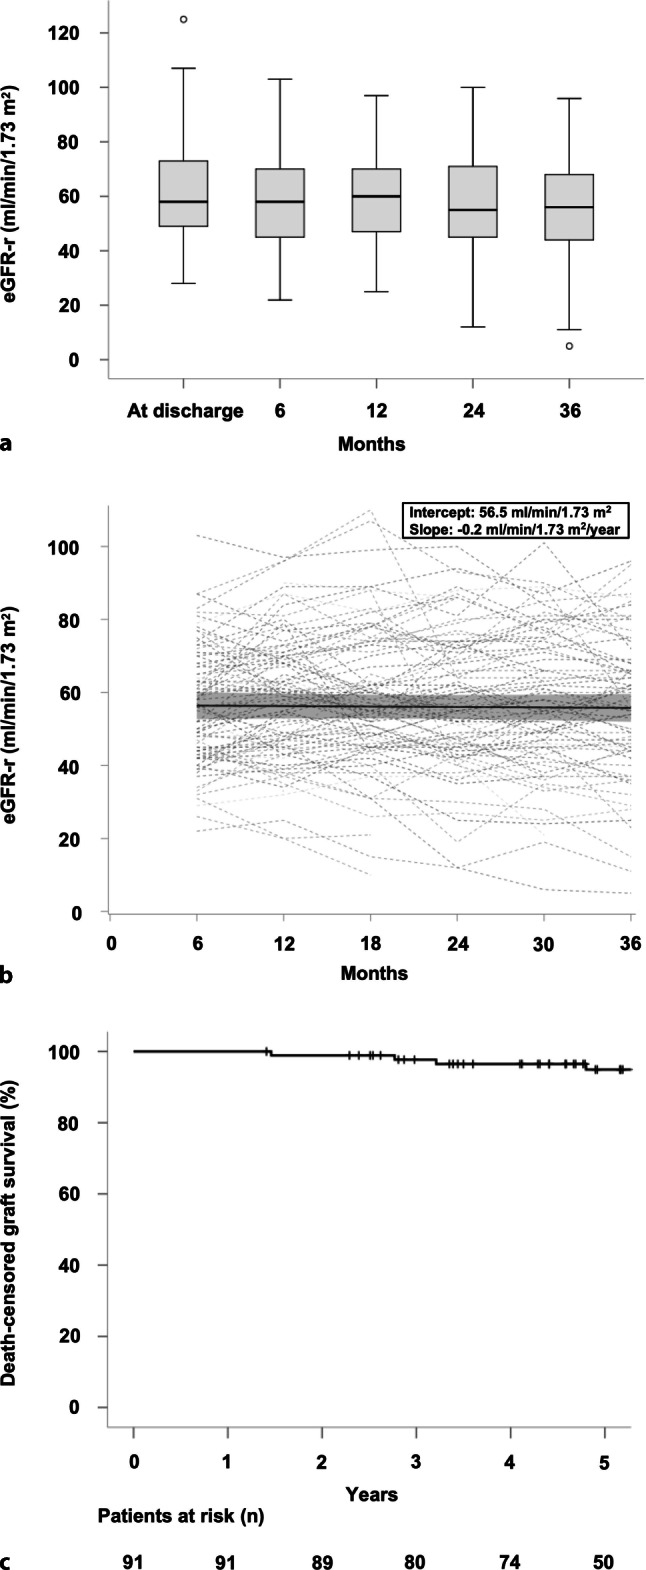
Fig. 2.

Transplant and patient outcomes. a Boxplots indicate the median, interquartile range, minimum and maximum of recipient estimated glomerular filtration rate (eGFR-r) at hospital discharge and at 6, 12, 18, 24 and 36 months after transplantation. b Individual courses of eGFR‑r (dashed lines) as well as its estimated mean (solid line) and the 95% confidence interval (grey area) computed from an unadjusted mixed model are shown for a period between 6 months (intercept) and 3 years after transplantation. c Kaplan-Meier curves show death-censored graft survival over a period of 5 years
