
TABLE 4.
Results from RSiena analysis that predicted the influence of friendships on peer support.
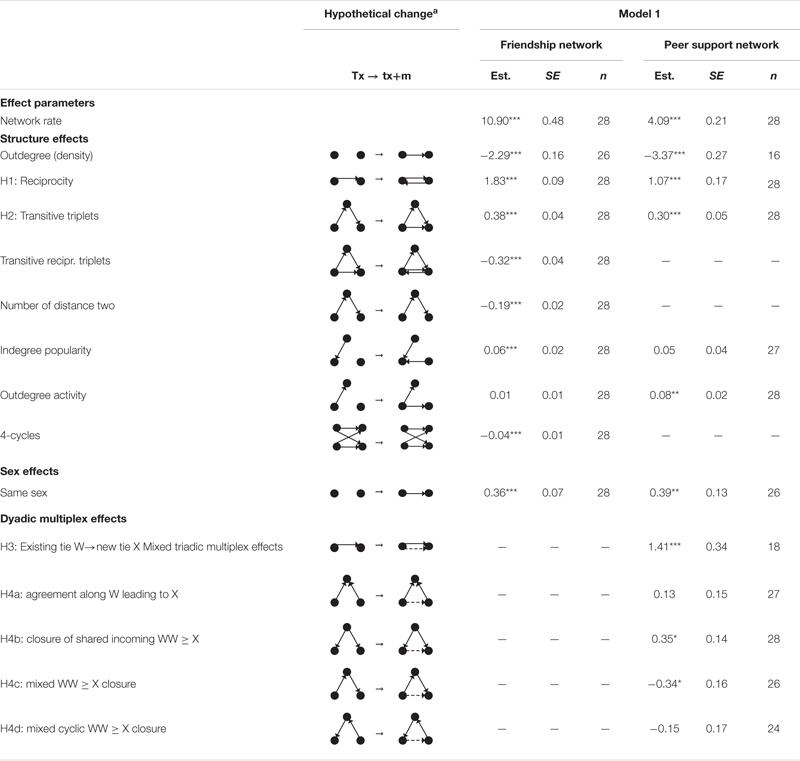 |
Significance was tested by dividing the estimates with the standard error, resulting in t-values that were approximately normally distributed (Ripley et al., 2020). Convergence statistics: t-ratio all < 0.10, and overall maximum convergence ratio < 0.25 (see details in Supplementary Table S2 for Model 1). aFriendships are represented by solid lines, and peer support relationships are represented by dashed lines when there two kinds of lines in the diagrams. *p ≤ 0.05, **p ≤ 0.01, ***p ≤ 0.001 (two-tailed test).