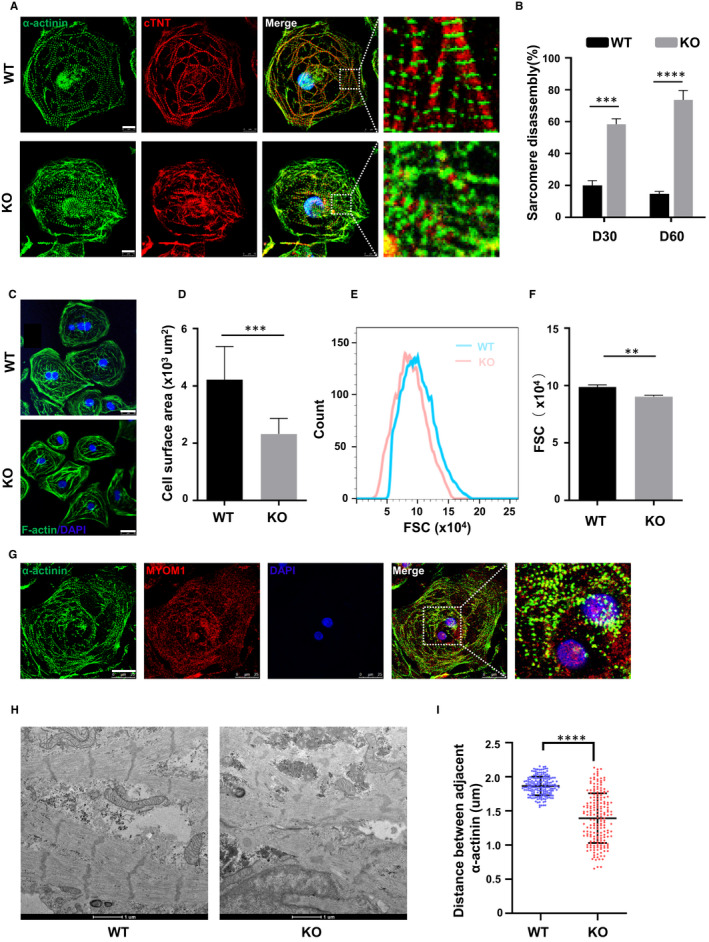
FIGURE 2.

Knockout of MYOM1 in cardiomyocytes causes disordered sarcomere and smaller cells (A) Immunostaining of α‐actinin (green) and cTnT (red) shows sarcomere disassembly in day 30 KO CMs (Scale bar, 10 μm). (B) Quantification of cardiomyocytes exhibiting sarcomere disassembly from two groups, respectively, in day 30 and day 60 CMs(n = 150). (C,D) Image of cardiomyocytes stained with F‐actin/DAPI at day 30, and the mean cell area reduced in KO CMs (Scale bar, 25 μm). (E, F) Calibration of forward scatter (FSC) in flow cytometry (FSC;10 000 cells/sample) shows a decreased volume in day 30 MYOM1−/− CMs (n = 3). (G) Image of myomesin‐1 locating in both cytoplasm and nucleus of day 30 WT CMs (Scale bar, 25 μm). (H) Disarranged sarcomere in knockout CMs observed by electron microscopy with partially twisted Z‐discs remaining (n = 185) (Scale bar, 1 μm). (I) Quantification of distances between adjacent α‐actinin, representing sarcomere length. Data are analysed with two‐sample t test and shown as means ± SD. **P < .01, ***P < .001, ****P < .0001
