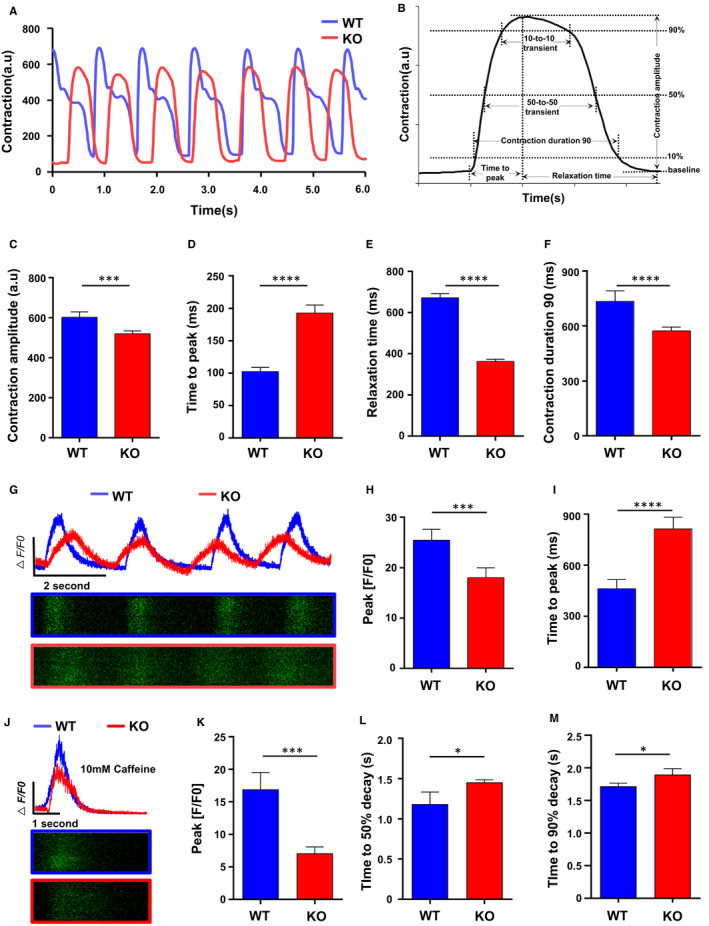
FIGURE 3.

Myomesin‐1‐deficient human cardiomyocytes develop contractile dysfunction. (A) After video recorded, the curve of contraction versus time was output by ‘MUSCLEMOTION’, showing the beating activity of D30 WT and KO CMs. (B) Several parameters can be extracted from the above curve for analysis. (C) contraction amplitude, (D) time to peak, (E) relaxation time and (F) contraction duration 90 were measured. (G‐I) Ca2+ transients of day 30 cardiomyocytes were imaged in individual cells after loaded with 5 μmol/L Fluo‐4AM (n = 20 cells per group). (J‐M) Ca2+ transient induced by 10 mmol/L caffeine exposure between WT and KO CMs (n = 5 cells per group), and relevant parameters were measured. Data are analysed with two‐sample t test and shown as means ± SD. *P < .05, ***P < .001, ****P < .0001
