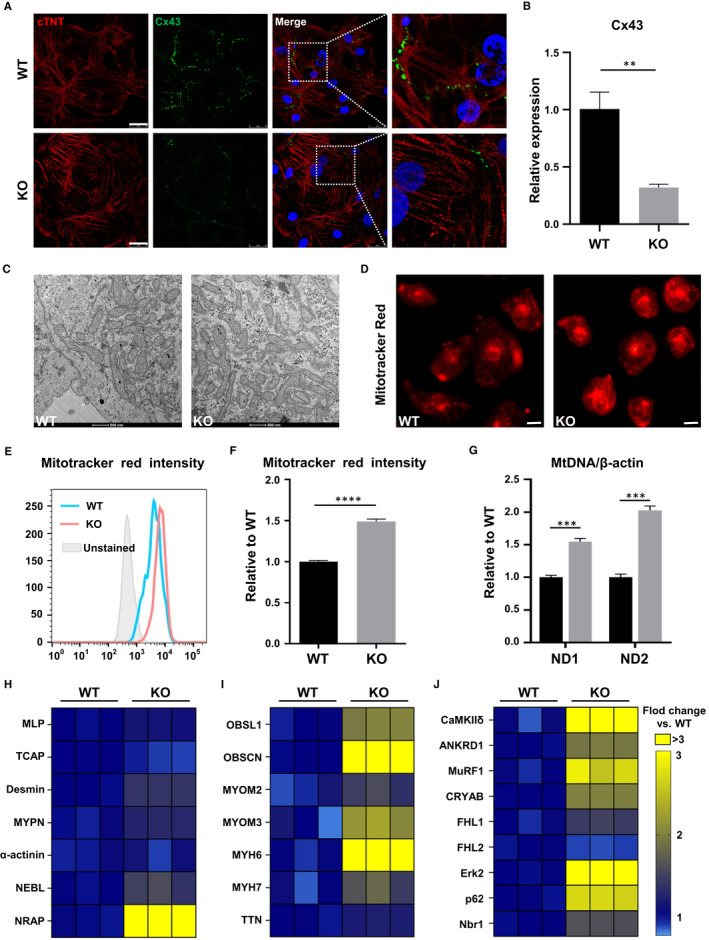
FIGURE 5.

MYOM1−/− hESC‐CMs are bearing many molecular and biological changes. (A) Confocal images of Cx43 and cTNT show an obvious decrease of Cx43 in D30 KO CMs compared with WT CMs (Scale bar, 25 μm). (B) Quantification of Cx43 on RNA level. (C) Representative transmission electron micrographs showing increased mitochondria in D30 KO CMs (Scale bar, 500 nm). (D, E, F) Images and fluorescence intensity of Mitotracker red, which stained mitochondria, also reveal an increase in the number of mitochondria in KO CMs (Scale bar, 50 μm). (G) Likewise, the ratio of mitochondrial DNA (ND1 and ND2) to nuclear DNA(β‐actin) elevated in MYOM1 knockout CMs. (H‐J) Respective heatmap of Z‐discs‐related, M‐band‐related and M‐band signalling associated genes expression in WT and KO CMs. Data are analysed with two‐sample t test and shown as means ± SD. **P < .01, ***P < .001, ****P < .0001
