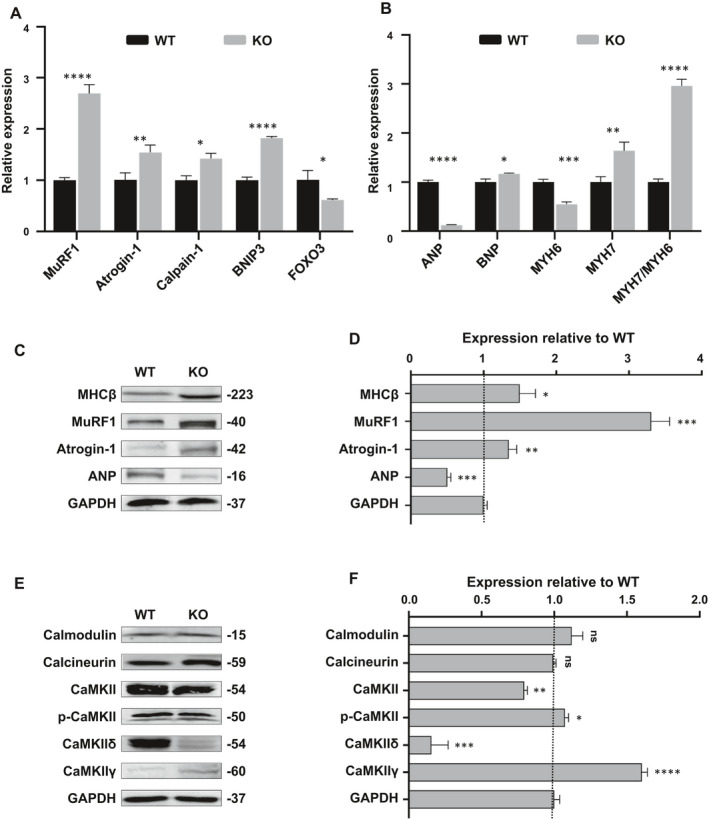
FIGURE 6.

Myomesin‐1‐deficient CMs display atrophic remodelling and abnormal CaMKII activity. (A) Quantitative real‐time polymerase chain reaction reveals that molecular markers of muscle atrophy significantly increased in KO CMs. (B) An atrophic switching of MHC isoform predominance occurred in KO CMs, namely decreased MYH6 but increased MYH7. ANP level showed a dramatic decline, whereas BNP increased slightly. (C, D) Western blot analysis of several important markers of myocardial atrophy, quantification of protein expression was normalized by GAPDH. (E, F) The expression of several major proteins in Ca2+‐dependent pathways was measured and normalized by GAPDH. Data are analysed with two‐sample t test and shown as means ± SD. *P < .05, **P < .01, ***P < .001, ****P < .0001
