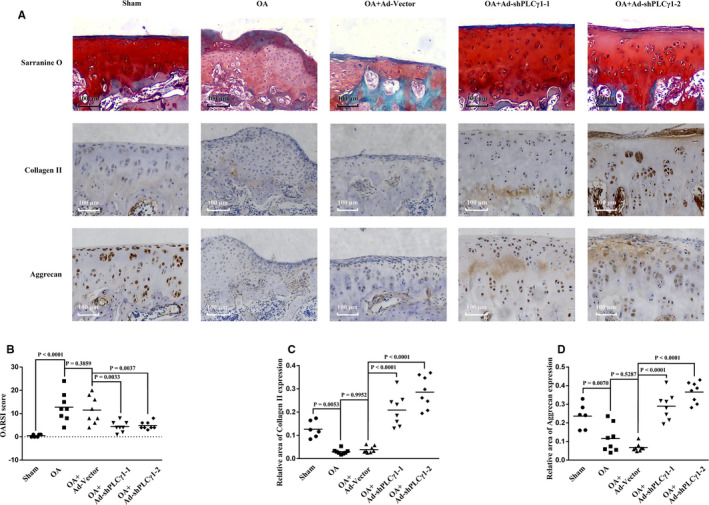
FIGURE 5.

Intra‐articular injection of Ad‐shPLCγ1 ameliorated cartilage damage in a rat OA model. A, Representative images of Safranin O/Fast green staining and immunohistochemistry assay for Collagen (1:100) and Aggrecan (1:1000) (original magnification × 10), respectively. B, Graph shows the OARSI score in different injected groups. C, Graph shows the relative area expressing Collagen II in different injected groups. D, Graph shows the relative area expressing Aggrecan in different injected groups. The values represent the means ± SEM
