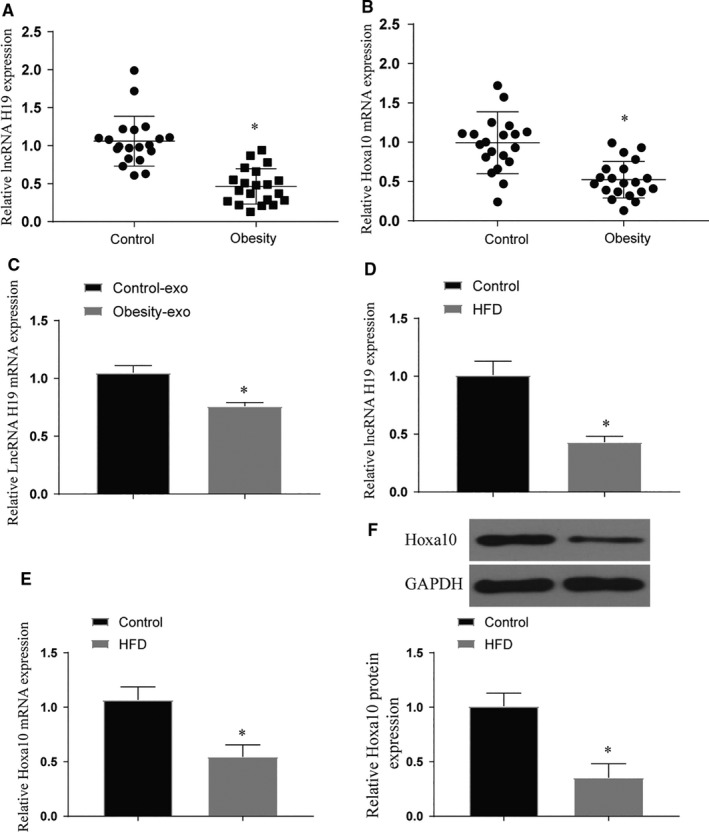
FIGURE 2.

Expression of lncRNA H19 and Hoxa10 in clinical samples and BMSCs after high‐fat treatment. (A‐B) Expression of lncRNA H19 and Hoxa10 in clinical samples, *vs control P < .05; (C) Expression of lncRNA H19 and Hoxa10 in exosomes of clinical samples, *vs control P < .05; (D‐F) Expression of lncRNA H19 and Hoxa10 after high‐fat treatment of BMSCs, *vs control P < .05. All data were means ± SD
