FIGURE 5.

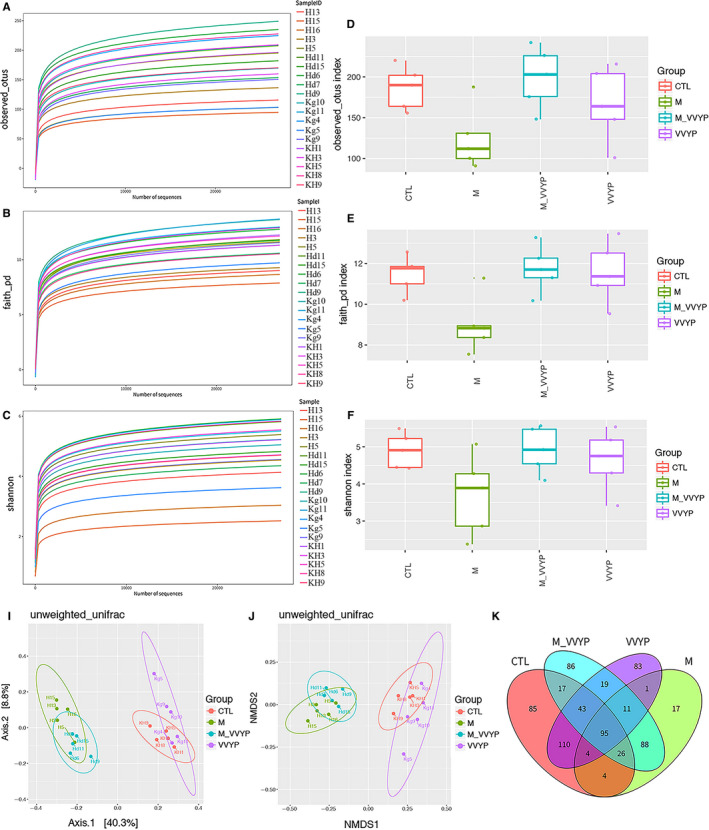
Influences of VVYP on the diversity, richness of the gut microbiota. C57 mice were divided into four groups (CTL, M, M‐VVYP, VVYP). A‐C, Refraction curve of observed index, Faith index and Shannon index. D, observed index. E, Faith index. F, Shannon index. I, principle component analysis (PCoA). J, non‐metric multidimensional scaling (NMDS) analysis. K, Venn diagram was used to show the common and unique operational taxonomic units between four groups
