FIGURE 6.

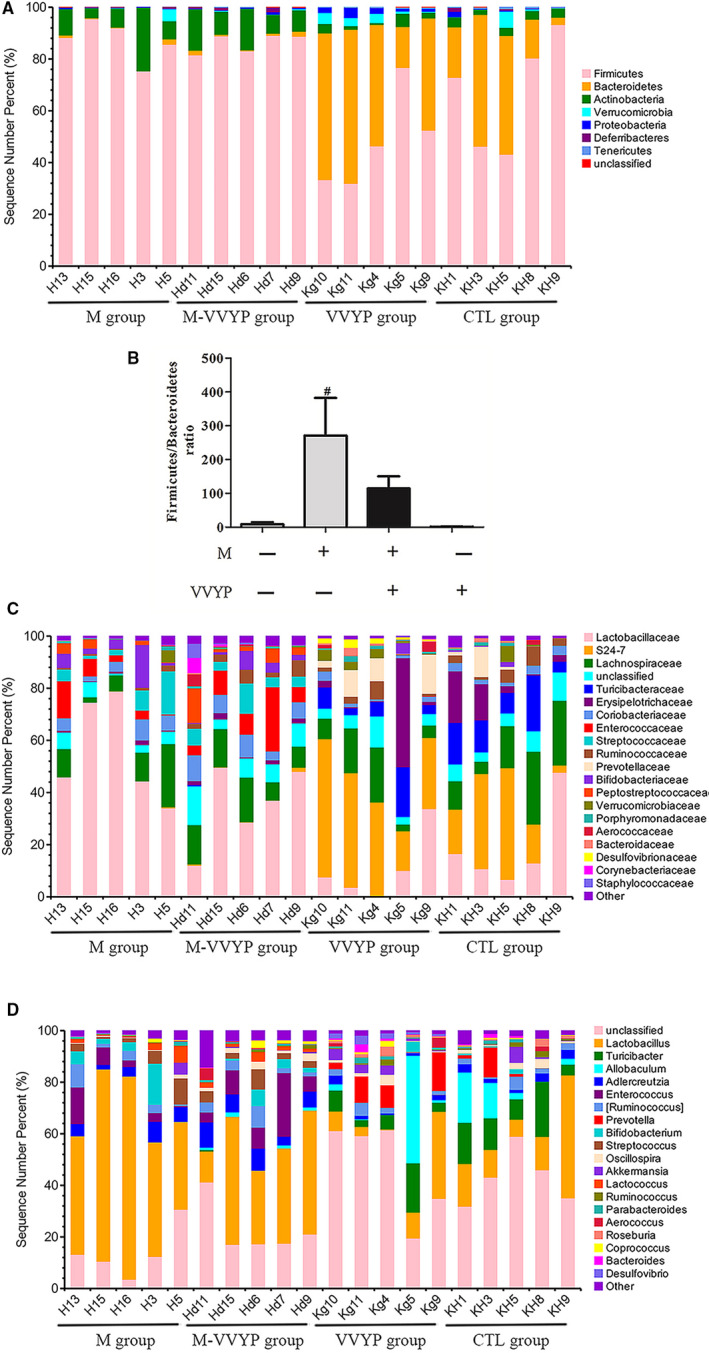
Effects of VVYP on the composition of the gut microbiota in HFD‐fed mice. Hierarchical cluster analysis. A, C and D, Bacterial composition of the different communities at the phylum level (A), family level(C) and genus level(D). B, Bar chart representing the FB ratio. #P < .05 vs CTL
