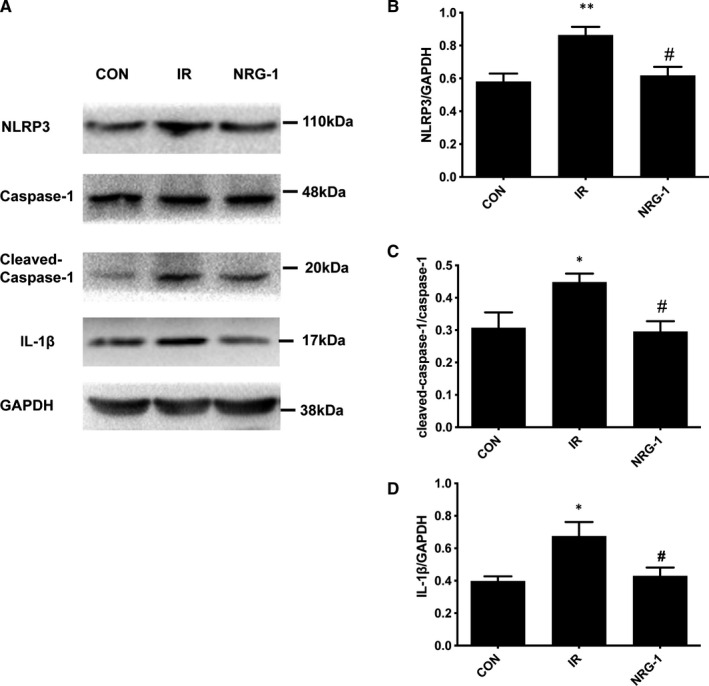
FIGURE 4.

NRG‐1 suppresses the NLRP3/caspase‐1 pathway. A. Representative Western blots showing the levels of NLRP3, caspase‐1, cleaved caspase‐1, IL‐1β and GAPDH. Semi‐quantification of NLRP3 level (B), the cleaved caspase‐1 density/caspase‐1 density ratio (C), and IL‐1β level (D). The expression levels of the target proteins were normalized to those of GAPDH. Data are represented as mean ± standard error of mean (n = 6; *P < .05,**P < .001 vs CON; #P < .05 vs. IR). CON, sham‐operated control; IR, ischaemia‐reperfusion; NRG‐1, IR + NRG‐1
