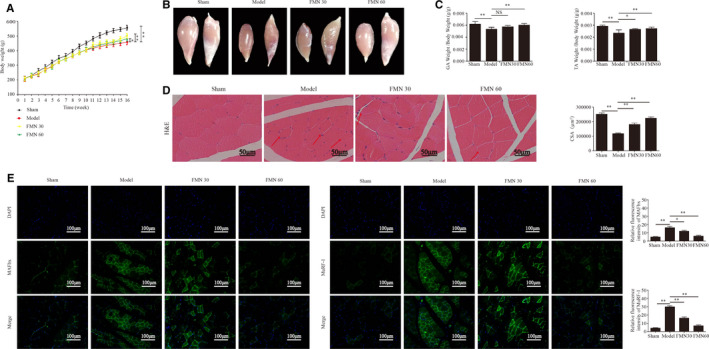
FIGURE 2.

FMN significantly improves muscle atrophy in CKD rats. (A) Bodyweight was determined weekly throughout the entire 16‐wk experimental period (n = 10/group). (B) Images of gastrocnemius and tibialis anterior muscles in each group, obtained with a stereoscope. (C) The weights of the gastrocnemius and tibialis anterior muscles were measured and normalized to the final bodyweight after sacrifice (n = 6/group). (D) Paraffin sections from the tibial anterior muscle tissues stained with H&E and observed under a microscope (magnification ×400). The red arrows indicate myofibres affected by atrophy. The cross‐sectional area of the muscle fibres of different groups was measured using Image J. (E) The MAFbx and MuRF‐1 expressions in the tibialis anterior muscle determined with immunofluorescence staining (200×) using anti‐MAFbx and anti‐MuRF‐1 (green) and the nuclei detected via DAPI staining (blue). The relative fluorescence intensities of MAFbx and MuRF‐1 were compared between the groups. *P < .05, **P < .01
