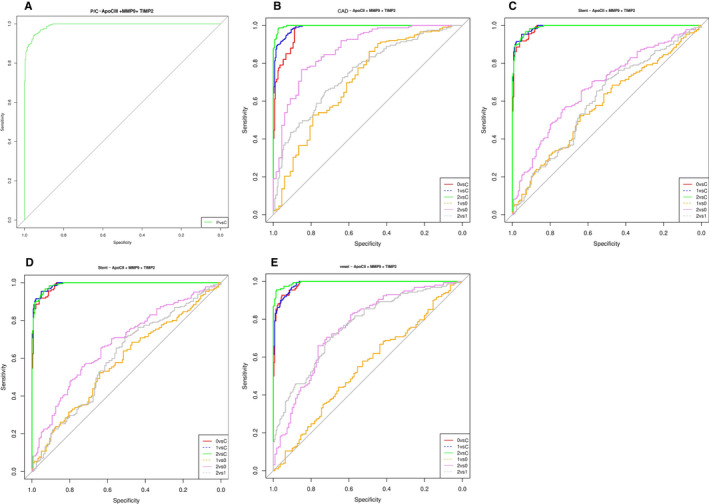
FIGURE 5.

A, Apo‐CIII, MMP‐9 and TIMP‐2 in patients vs controls, AUC = 0.991. B, Apo‐CII, MMP‐9 and TIMP‐2 in CAD patients subgroups vs controls, AUC = 0.997. C, Apo‐CII, MMP‐9 and TIMP‐2 in‐stent treatment patients subgroups vs controls, AUC = 0.9915. D, Apo‐CIII, MMP‐9 and TIMP‐2 in‐stent treatment patients subgroups Vs controls, AUC = 0.9914. E, Apo‐CIII, MMP‐9 and TIMP‐2 in number of stenosed vessel vs controls, AUC = 0.995. Diagnostic performance of a multiplex protein biomarker assay (Apo‐CII or Apo‐CIII, MMP‐9 and TIMP‐2). ROC was plotted to describe performance characteristics in the 757‐subject cohort (controls and different patient's subgroups) (Figure 3A–E). AUC, area under the curve; C, control; CAD, coronary artery diseases; P, patients, CAD subgroups (0: stable angina, 1: NSTEMI, 2: STEMI), stent treatment (0: no stent treatment, 1: BMS (Bare‐metal stent), 2: DES (Drug elution stent)), number of stenosed vessels (0: one stenosed vessel, 1: two stenosed vessels, 2: three stenosed vessels)
