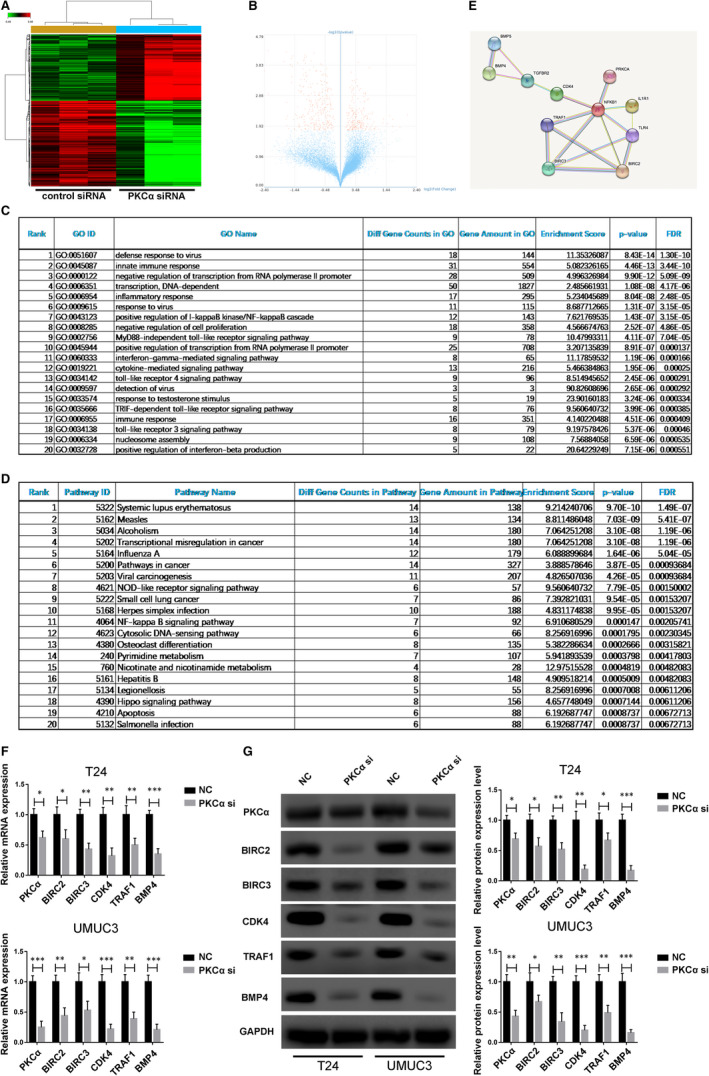
FIGURE 3.

Gene expression microarray analysis of PKCα target genes in bladder cancer cells. (A and B) Representative heat map and volcano maps showing the expression of different target genes in the normal control group and the PKCα siRNA group. (C and D) The top 20 affected biological processes or pathways in PKCα knockdown J82 cells based on GO and KEGG pathway analyses. (E) Schematic of the protein‐protein interaction analysis using STRING software. (F and G) Relative expression of the five key genes in T24 and UMUC3 cells with PKCα knockdown was detected with qRT‐PCR and Western blotting
