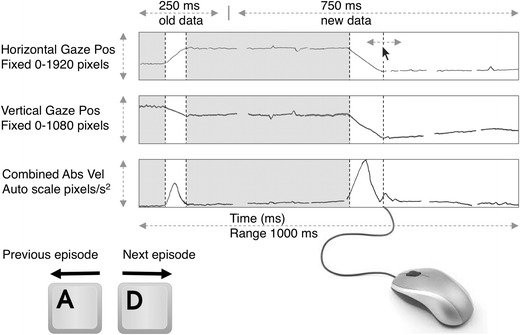
Fig. 1.

Coding interface with example data. The graphical user interface consists of three panels (horizontal gaze position, vertical gaze position, and absolute velocity). The y-axis of velocity is autoscaled to the largest velocity in the display, and the other two vertical axes are fixed. The display contains 1,000 ms of data (250 ms of data from the previous display, 750 ms of new data). Navigation back and forth in time is done with the “a” and “d” keys, and fixation start and end are indicated by the mouse. Already classified fixations are colored light gray in the real interface. Earlier settings can be modified and removed with the mouse
