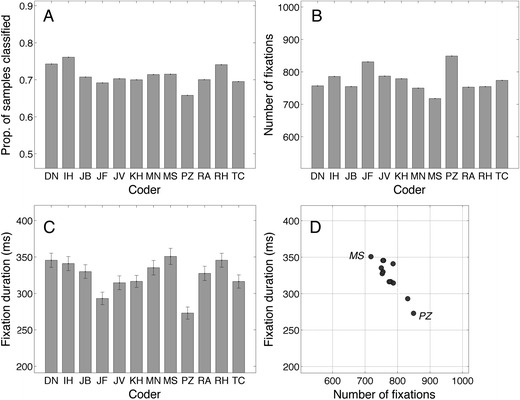
Fig. 3.

(a) Proportions of samples classified as fixations. (b) Numbers of fixations. (c) Fixation durations. Error bars denote standard errors of the means. (d) Fixation durations versus number of fixations (r = –.905, p < .001). Each point represents the data of one coder
