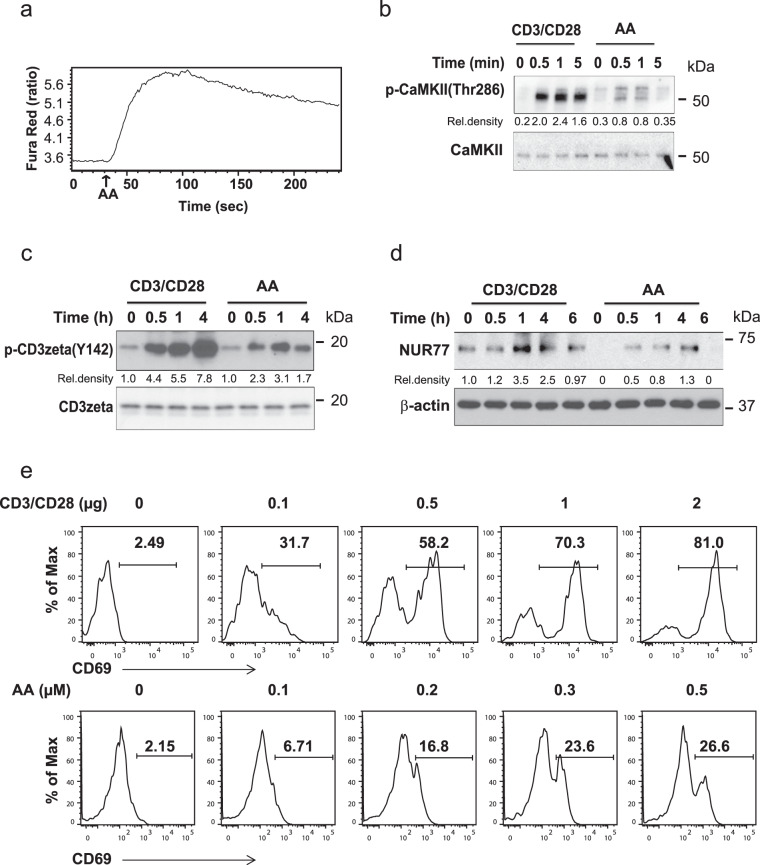
Fig. 3. Functional consequences of arachidonic acid stimulation of naive CD4+ T cells.
a Flow cytometry analysis of AA-induced Ca2+ influx after stimulation with 0.1 µM AA. The ratio of shifts in Fura Red fluorescence (at 406 and 532 nm) is shown at indicated times. b Immunoblot analysis of Ca2+-dependent CaMKII phosphorylation in CD4+ naive T cells after crosslinking with immobilized 100 ng/ml anti-CD3/CD28 mAb or 0.3 µM AA stimulation. c Immunoblot analysis of CD3ζ (Y142) phosphorylation in CD4+ naive T cells after 0.3 µM AA activation or stimulation with immobilized 100 ng/ml anti-CD3/CD28 mAb. d Immunoblot analysis of NUR77 expression in naive CD4+ T cells after 0.3 µM AA or 100 ng/ml anti-CD3/CD28 mAb stimulation. All uncropped Western blots in Supplementary Fig. 9. e Flow cytometric analysis of CD69 expression in naive CD4+ T cells stimulated by increasing concentrations of AA for 3 min and then cultured for 24 h. Anti-CD3/CD28-induced CD69 expression was used as a positive control. Results in a–e are each representative of two experiments.

