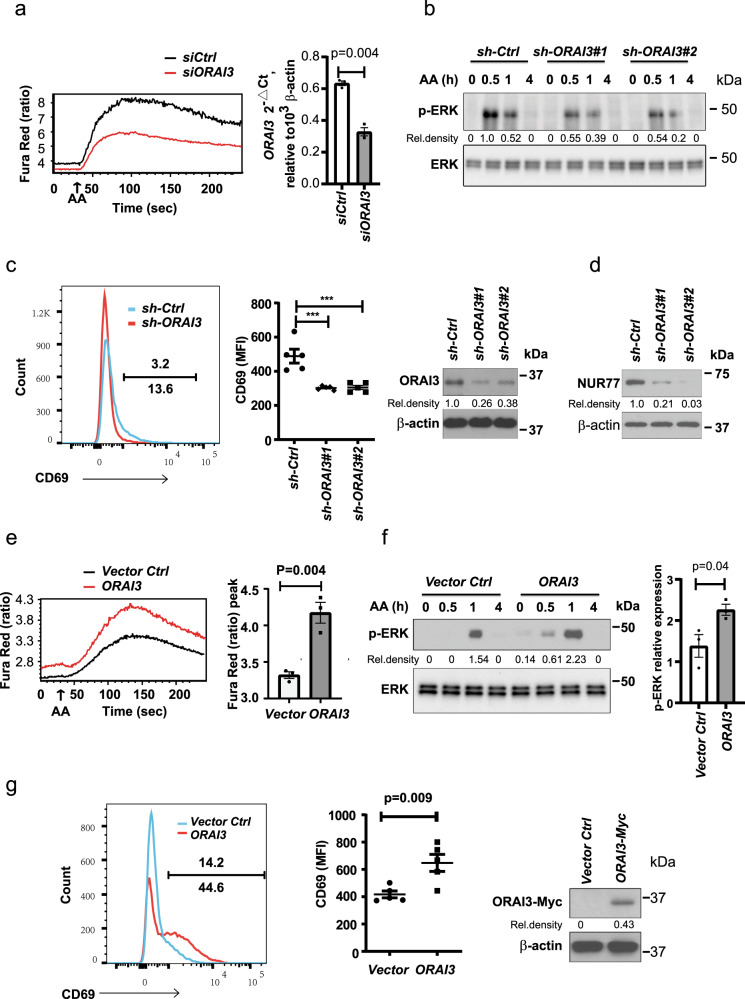
Fig. 4. Arachidonic acid acts through ORAI3 to activate T cells.
a Naive CD4+ T cells were transfected with ORAI3 siRNA smart pool or control siRNA; after 48 h, Ca2+ influx was monitored over time (210 s) by flow cytometry of Fura Red with 0.1 µM AA added after the first 30 s (left). Right, knockdown efficiency. b CD4+ naive T cells transduced with lentivirus expressing ORAI3 shRNA #1, ORAI3 shRNA #2, or control shRNA were assayed for p-ERK (Thr202/Tyr204) at 0.5, 1, or 4 h after 0.3 µM AA stimulation. Uncropped Western blots in Supplementary Fig. 9. c Representative histograms of constitutive CD69 expression in Jurkat cells stably transduced with ORAI3 shRNA or control shRNA (left). Results of CD69 expression in control and ORAI3-silenced Jurkat cells from five experiments (middle, *** = p < 0.0001). The efficiency of ORAI3 silencing was confirmed by immunoblotting (right). d Immunoblot analysis of NUR77 expression in Jurkat T cell transduced with ORAI3 shRNA #1, ORAI3 shRNA #2, or control shRNA. Data represent one of two independent experiments. e Flow cytometry of AA-induced Ca2+ influx as determined from the ratio of shifts in Fura Red (at 406 and 532 nm) fluorescence in Jurkat T cells stably overexpressing ORAI3. Representative tracing of Fura Red ratios (left) and the peak calcium influxes from three experiments are shown (right). f Immunoblot of ERK phosphorylated at Thr202/Tyr204 from ORAI3-overexpressing Jurkat cells at indicated time points (0, 0.5, 1, and 4 h) after 0.3 µM AA stimulation (left) and peak p-ERK responses from three experiments are shown (right). g Flow cytometry of constitutive CD69 expression by ORAI3-overexpressing and vector control Jurkat T cells (left). CD69 expression summarized from five experiments (middle). Immunoblots documenting ORAI3 overexpression (right). Uncropped Western blots of c, d, f, g in Supplementary Fig. 10. Data are presented as mean ± SEM (a, c, e, f, g). Results in a, b, e, and f are each representative of three experiments. Data were analyzed by paired two-tailed Student’s t test (a), by one-way ANOVA followed by Tukey’s multiple comparison test (c), or by unpaired two-tailed Student’s t test (e–g). Source data are provided as a Source Data file.

